
Ask most people with a working knowledge of content marketing to define an infographic for you, and you’re likely to get some version of the following: “A visual representation of complex data.”
This definition gets more than a few things right: Infographics are meant to be digested visually first and textually second. That’s what separates them from formatted one-pagers, brochures or white papers. They are supposed to take topics that are difficult or time-consuming to explain with the written and present them visually, so that they can be understood almost instantaneously. They make the complicated seem simple.
Of course, all definitions have their problems. They rarely, if ever, manage to account for the full range of meanings and possibilities inherent in the concepts they define. Plus, they’re open to misinterpretations that can further limit the way we think about certain things and ideas. And when we believe in those misconceptions, our creativity suffers for it—limited definitions limit us, too.
Too often, the “data” portion of “a visual representation of complex data” ceases to mean “useful information” and ends up meaning something much more paltry: Numbers.
Numbers have power, but can be limiting
There’s a good reason this is the case. Numbers are compelling. They exude authority. When presented well, they feel incontrovertible. You can’t argue with a good stat. The best stat-heavy infographics have this same sense of authority.
A wholly statistical graphic can be authoritative, but is it conversational? It may be extremely helpful, but does it make people laugh?
But after we’ve seen so many statistically-driven infographics, we may begin to believe this is the only thing they can do – and this is where the danger lies.
Pigeonholing infographic content to visual presentations of statistics limits the engagement this format is capable of eliciting. A wholly statistical graphic can be authoritative, but is it conversational? It may be extremely helpful, but does it make people laugh?
Sure, a really amazing infographic might do all of these things, but do all infographics need to? Clearly, not every graphic is going to have both the hilarity of Aziz Ansari and the expertise of Ben Bernanke, nor should it. Humor, authority and insightful statistics are things some really good infographics contain, but none of them is essential to success.
Which brings us directly up against the question: What makes a good infographic, anyway?
The real virtues of infographics
In a post for the Harvard Business Review blog, the publication’s senior editor Andrea Ovans offered some compelling reflections on the nature of infographics and where the best examples of this content type get their power to convince and entertain. She also spoke with Gareth Cook, the editor of The Best American Infographics 2013, to get his expert take on the matter. Here are a few of the key elements they highlighted in their discussion of the virtues of infographics.
1. Brevity drives engagement
One of Ovans’ key insights is that there’s a direct connection between infographics’ ability to engage and entertain and remain compact
“A great infographic is an instant revelation. It can compress time and space.” – Andrea Ovans
“A great infographic is an instant revelation. It can compress time and space,” she wrote.
This is a key point that might be easy to overlook. The stat-minded approach to infographics might suggest that the more numbers, the better, but the result might fail to have that feeling of “instant revelation” and clarity that Ovans is talking about. The right stat can go a long way, but too many can result in a muddied picture that’s difficult to decipher (both in terms of content and design).
2. Approachability helps communicate your message
Closely related to brevity is another crucial point: Infographics should be easy to digest and comprehend. In his conversation with Ovans, Cook noted that one of the essential jobs this type of content performs is that of simplification.
“Infographics can make an abstract subject concrete – let viewers put their hands around it,” he told Ovans.
Not only can too many stats crowd the graphic and obscure your point, but so can pieces of data that are too technical, esoteric or otherwise incapable of making a direct connection with the viewer.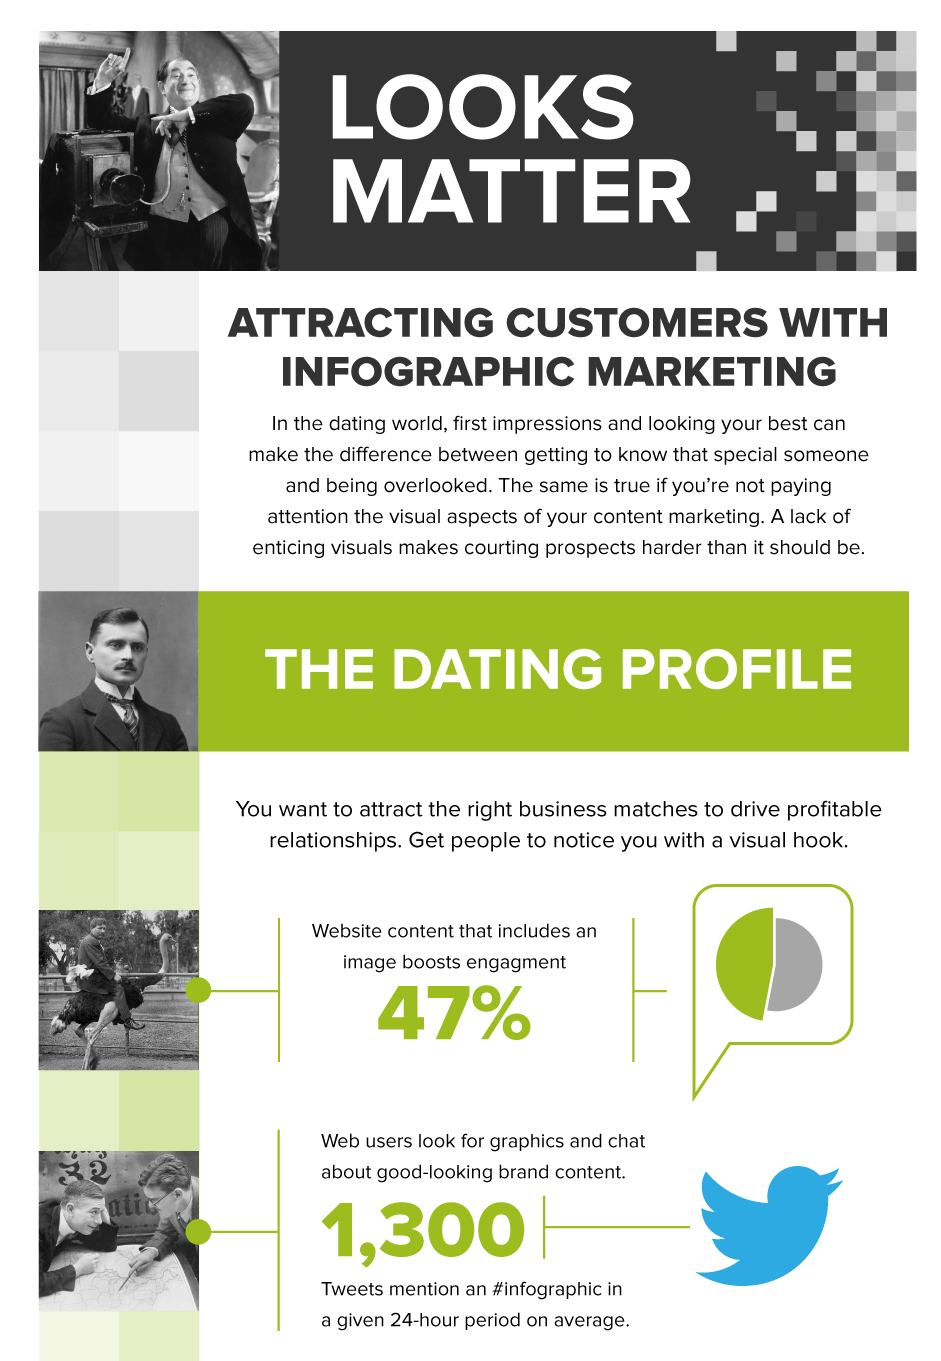
3. Insightfulness elicits an emotional response
Ultimately, however, all of this would be for naught if the information itself wasn’t useful or important. And when presented correctly, insisted Cook, that kind of insight feels striking, surprising, jarring. It has an emotional effect.
“A persuasive infographic surprises the viewer. It moves them in some way and makes them want to keep looking at it or show it to other people,” he suggested to Ovans.
Make a great graphic first and foremost – then worry about the data points
Statistics, then, can be either a help or a hindrance to infographics. They can provide lightning-bolt insight and convince in almost an instant, or they can cloud, muddy and confuse. They can be a critical tool, but they’re not the only one in the chest, nor are they always the best or right one.
In a piece for his company’s official blog, Unbounce co-founder Oli Gardner offered an eminently sane and straightforward opinion on the subject.
“Information doesn’t need to be purely numerical. So a graphic with information on it is an infographic whether or not it’s statistical or not – I really don’t care. If you can find data, great, add it – but don’t let its absence stop you from creating your (info)graphic,” Gardner wrote.
At the end of the day, creating a great infographic marketing strategy doesn’t require access to a vast array of hard stats on a given topic. It requires insight, creativity, familiarity with the form and a certain, less definable synergy between content and design that will make the viewer say, “Ah! I get it!” upon first glance.
Which goals is your infographic strategy chasing?

