
Instagram is huge. Since launching in 2010, it has amassed more than 1 billion active users, evolving from a boutique picture-sharing service into an endlessly scrollable stream of photos, short videos and live broadcasts.
In that respect, it’s now a lot like TV, and so it shouldn’t be surprising that it and other popular platforms including YouTube, TikTok and Twitter have gradually eroded the amount of time people spend in front of their TV sets:

Like TV programming, Instagram content is also statistically analyzed to determine its reach and engagement.
The key metrics of Instagram are somewhat similar to the Nielsen ratings of TV shows, in that they provide insights into how many people are paying attention over a given timespan. However, Instagram metrics (alternatively, Instagram analytics) are much more sophisticated.
7 Instagram metrics to keep track of:
- Reach.
- Impressions.
- Engagement.
- Follower growth rate.
- Profile views and referral traffic.
- Popular hashtags.
- Instagram Stories analytics.
Instagram metrics and their purpose, explained
Using Instagram’s own analytics tools (Instagram Insights) or one or more paid or free third-party solutions (including Sprout Social, HootSuite, Buffer and Google Analytics), a social media manager can see:
- How many unique accounts viewed a specific piece of content.
- Trending and popular hashtags on the platform.
- Changes in follower counts.
- The number of visits to the monitored account’s profile page.
- Total clicks on website links and call/email buttons on a profile.
- Mentions of their account’s handles.
- Audience demographics including age, gender and location.
- Individualized breakdowns of Stories and Live posts.
It’s a lot of information to keep track of, no doubt.
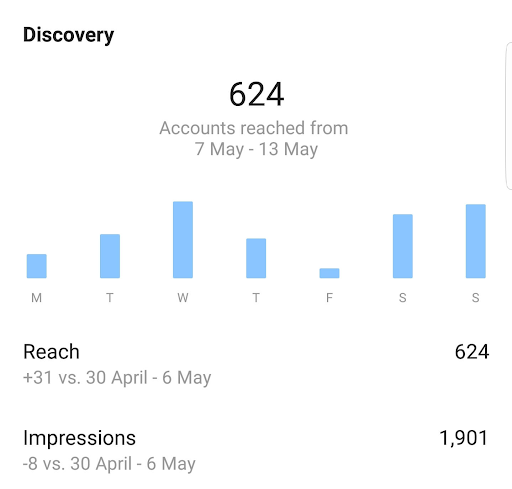
Here’s just one possible view – this one centered on reach and impressions – of what you might see upon opening Instagram Insights, the social network’s built-in metrics service:

By adding in other analytics solutions that can run customized reports, the data analysis options for Instagram business accounts become virtually endless.
But before going into what these metrics actually measure and how to collect and contextualize them, let’s answer a simple question:
Why bother digging into these numbers at all?
If you can’t measure it, you can’t improve it.
Because they provide understandable performance benchmarks for social media marketing and influencer campaigns. Renowned management consultant Peter Drucker once famously stated that “If you can’t measure it, you can’t improve it.” This adage is especially true of services such as Instagram, which generate such a substantial volume of metrics that can be channeled into improvement efforts.
Without regular reviews of Instagram metrics, an organization runs the risk of not knowing:
- Who its main audiences are.
- Whether it’s posting too frequently or too far apart.
- If it’s running relevant and engaging ads.
- How Instagram content is working within its sales funnel.
The last one is key.
Like search engines, Instagram is overflowing with people who have purchase intent. More than 80% of Instagrammers use the platform to research or discover new products and services and to determine if they’re worth buying. The stakes are high for knowing exactly what does and doesn’t work – and only Instagram metrics can provide that insight.

The difference between adept and inept usage of analytics can be stark.
On the successful side, this ESPN campaign used skillful analysis of its audience’s favorite sports – and perhaps winking knowledge of a famous button-related meme – to create an irresistible quiz that garnered tens of thousands of comments.
Less successful campaigns often misread their intended audiences, in part due to inadequate metrics analysis.
This Vera Bradley one came across as tone-deaf for seeming stereotypical and heavy-handed – something its handlers might have avoided had they delved more into demographic breakdowns.
At the same time, anyone diving into Instagram metrics needs to know what to prioritize. Some metrics are more useful than others, both in general and within specific industries.
Let’s look at what to track most closely for Instagram campaigns and ads.
7 of the most revealing Instagram metrics
Instagram analytics offer data points on virtually everything that happens on a business account.
Two of the basic metrics available in Instagram Insights – reach and impressions – provide good starting points for evaluating social media success, but should also be used alongside more nuanced indicators such as engagement rate and website click-throughs to get a full picture of campaign performance.
Here’s a rundown of some of the key Instagram metrics, from the simple to the more complex, with benchmarks and other considerations as applicable:
1. Reach
What it is: Reach is a measure of the number of unique users who saw an Instagram post or Story. It doesn’t indicate any further action.
Why it’s useful: Reach reveals how many different viewers an account is connecting with. As such, it’s a good proxy for brand awareness. Its main limitation is that it doesn’t register repeat views from the same account; that’s what impressions are for.
Benchmarks and considerations: Reach will vary significantly based on the size and activity of an account’s audience, as well as ad spend if the post were promoted. While there’s no absolute benchmark to strive for, it’s prudent to keep an eye on reach rate, which is the reach of a post expressed as a percentage of an account’s followers.
Since the Instagram algorithm delivers a personalized feed for each user based on what they engage with and how often they use the app, reach metrics are not entirely under a business account’s direct control. At the same time, there are multiple actions to take that can increase reach, including cross-posting content to a company blog or other social media channels.
2. Impressions
What it is: An Instagram impression is an indication that a piece of content simply appeared in someone’s feed. Impressions are not limited to unique accounts, meaning that they could have accumulated from repeat visits. Impressions are available for Instagram posts and Stories. Content doesn’t have to be liked, commented on or even seen to generate an impression – it simply has to be displayed.
Why it’s useful: Impressions help measure campaign engagement among a target audience. Since they aren’t restricted to unique views, they can indicate that someone is seeing a post multiple times. So three views of the same posted video by one user would count as three impressions, and might signal high interest. If a post has a high impressions-to-reach ratios (i.e., it has generated many more impressions), that’s usually a good sign, since it shows that it’s connecting with an engaged audience who may be more likely to convert.
Benchmarks and considerations: Impressions are similar to reach as a metric, with the inclusion of non-unique viewers as the main difference between them. Like reach, impressions are partially dependent on audience size, demographics and ad spend, and as such will be benchmarked differently for each organization. Still, the impression-to-reach ratio we mentioned above is important to keep an eye on for any brand, as is the average number of impressions per user, which can be calculated by dividing total impressions by total reach.
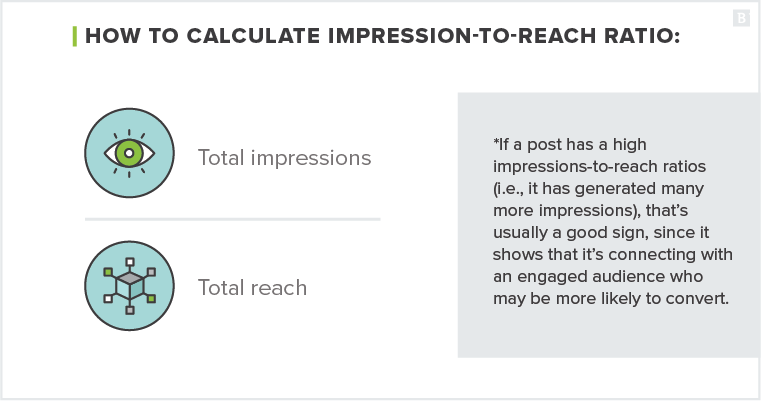
How to calculate the impression-to-reach ratio:
Total impressions / total reach
*If a post has a high impressions-to-reach ratios (i.e., it has generated many more impressions), that’s usually a good sign, since it shows that it’s connecting with an engaged audience who may be more likely to convert.
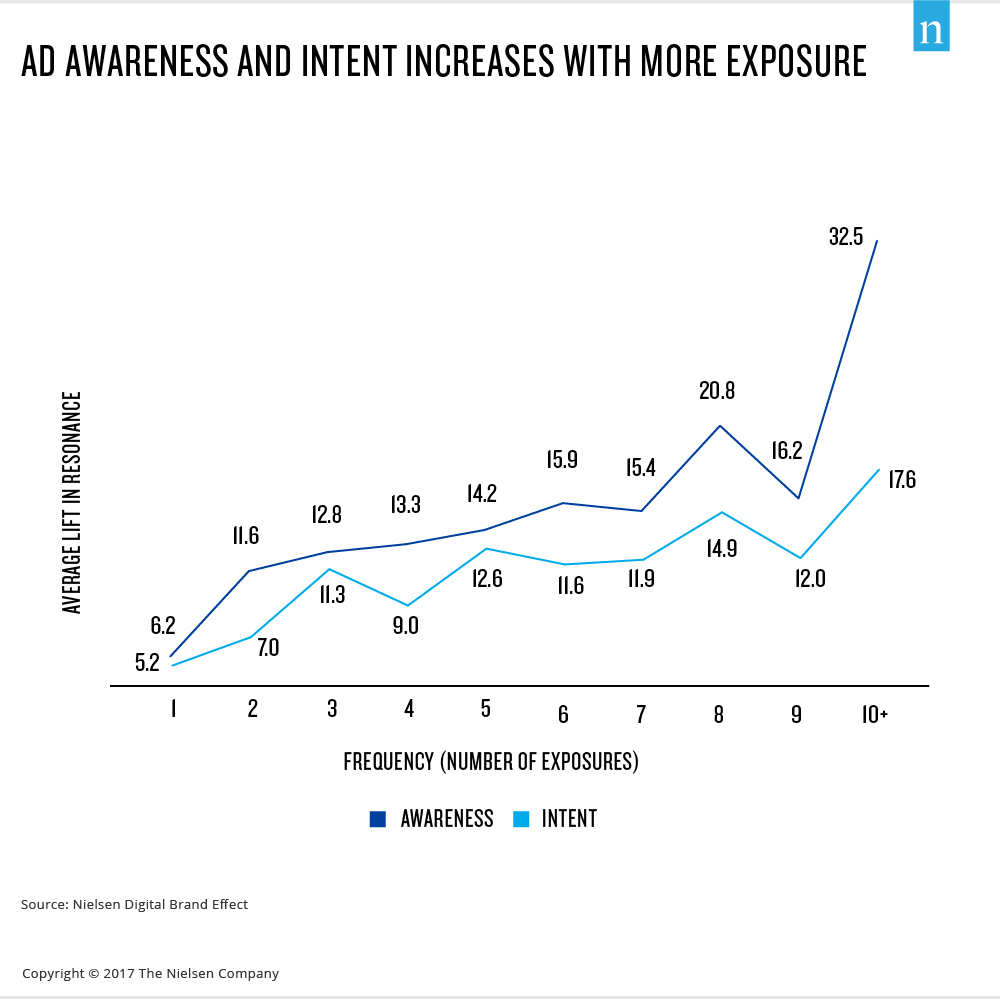
Knowing average impressions per user is critical to determining if someone is seeing an ad multiple times and in turn approaching its effective frequency. This term refers to how often someone needs to see a post or ad before it really drives up awareness and buying intent.
This Nielsen chart captures this effect nicely:
Effective use of hashtags is one of the more reliable ways to increase impressions. Like reach, though, impressions are subject to Instagram’s algorithms and aren’t fully within a brand’s control.
3. Engagement
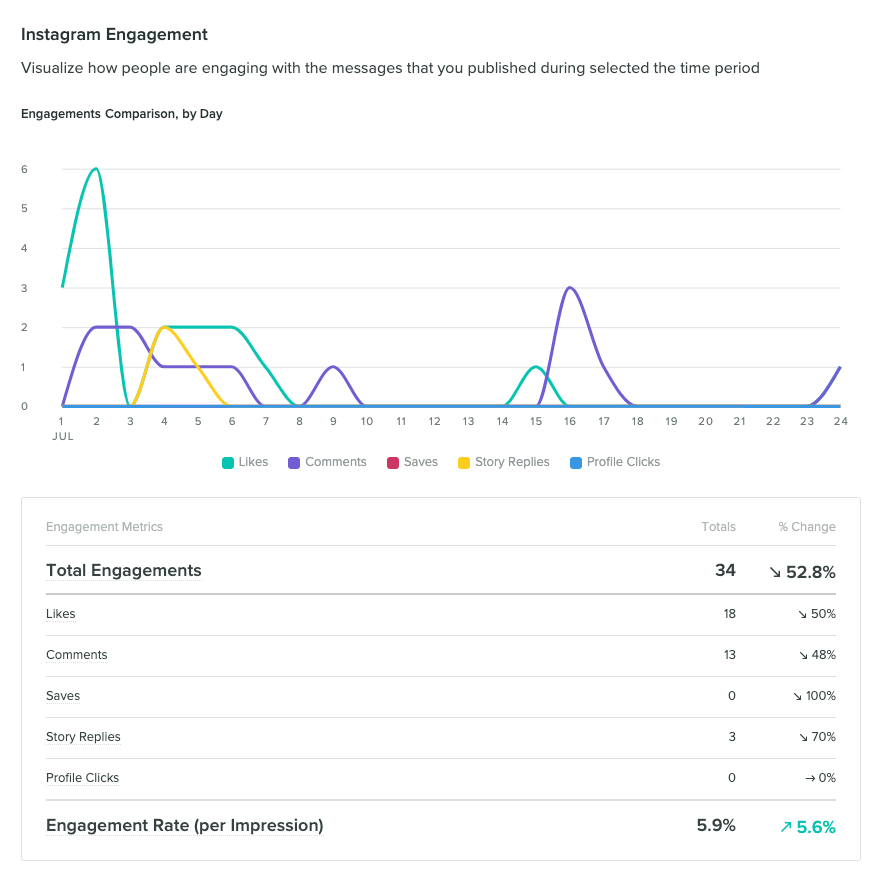
What it is: Now we’re getting into more sophisticated territory. Engagement includes all comments, likes, shares and saves for Instagram content. In other words, it goes beyond reach and impressions to show whether an audience did something in response to seeing a post or Story. This Sprout Social dashboard provides a typical view of how engagement might be tracked over time:
Why it’s useful: Engagement reveals how audiences are responding to a campaign. Are they leaving a lot of comments, like in the case of that hugely successful ESPN quiz, or finding the post not worth their time to bother with? Have users been saving a post for later, perhaps for purposes of product research, or are they just seeing it and moving on?
Benchmarks and considerations: Since it’s a more complicated metric than either reach or impressions, engagement requires more in-depth analysis to yield any insights about social marketing campaign performance. There are multiple analytics within it, indicating very different activities:
- For example, likes don’t provide much info and can be easily faked by automated liking services. Instagram itself has considered hiding them, thanks to the growing perception that they are a vanity metric that doesn’t really show how well a post is doing.
- In contrast, comments usually require much more effort in order to seem genuine, and are generally better at indicating that a brand has a responsive fanbase. Indeed, comments received on a post is an essential engagement metric.
Like reach and impressions, engagement must be placed in context of the size of a company and its total Instagram followership. This is why engagement per follower is a useful analytic.
It’s the product of dividing total engagement by follower count and then multiplying it by 100 to get a percentage that shows how many followers are engaging. That’s a more useful metric than total engagement, which will inevitably fall short of the big numbers posted by major brands.
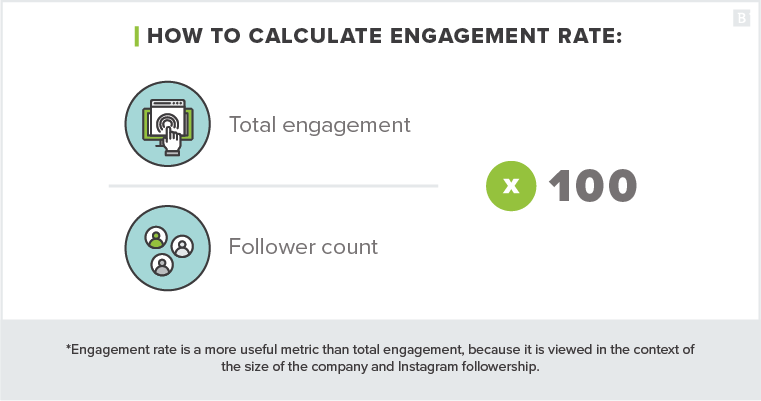
How to calculate engagement rate:
Total engagement / follower count * 100
*Engagement rate is a more useful metric than total engagement, because it is viewed in the context of the size of the company and Instagram followership.
Along similar lines, the engagement rate percentage is useful for both B2C and B2B organizations, which have big gaps in their typical audience sizes and demographics. Take this ZenDesk post as an example of how a post can be deemed successful even on a relatively small scale:
ZenDesk is a provider of help desk software for businesses and had slightly more than 14,000 Instagram followers as of September 2019, or far less than a B2C brand like Oreo, which had more than 2.6 million at that time. But the post above received 674 likes and 26 comments. Totaling those two numbers and dividing by ZenDesk’s follower count, that translates into an engagement rate of approximately 5%, which is easily above the 1% to 3% range generally seen as average or good.
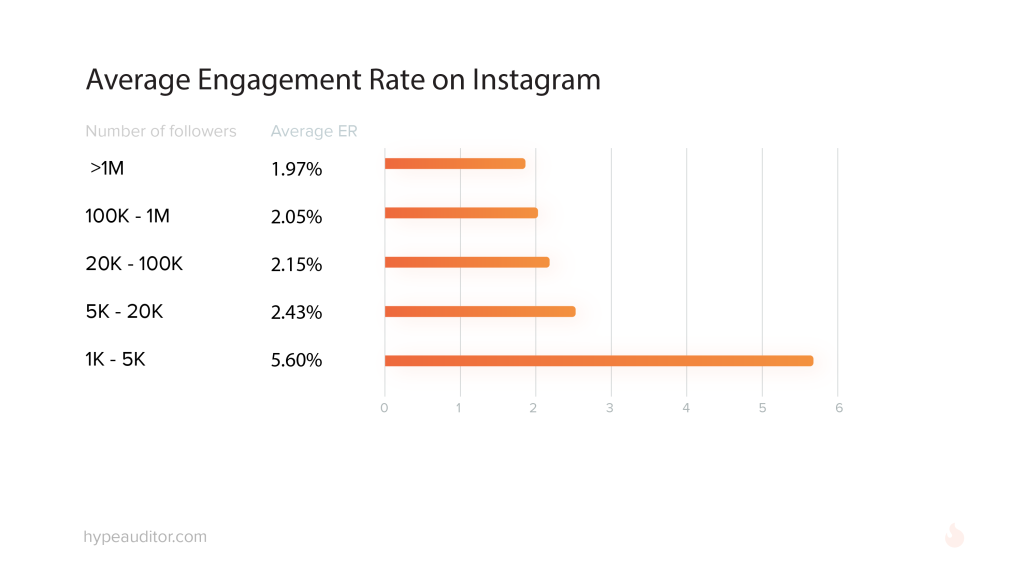
Benchmark engagement rates vary by industry and by account followership.
Whereas a 3% engagement rate would put a retail business ahead of most of its peers, the same rate would lag behind the field in food and beverage. This chart also shows how average engagement naturally varies by number of followers:
4. Follower growth rate
What it is: A measurement of how many followers were gained or lost over a specified timeframe. Here’s how this key metric could be tracked from within Buffer for Business, another tool for understanding Instagram analytics:
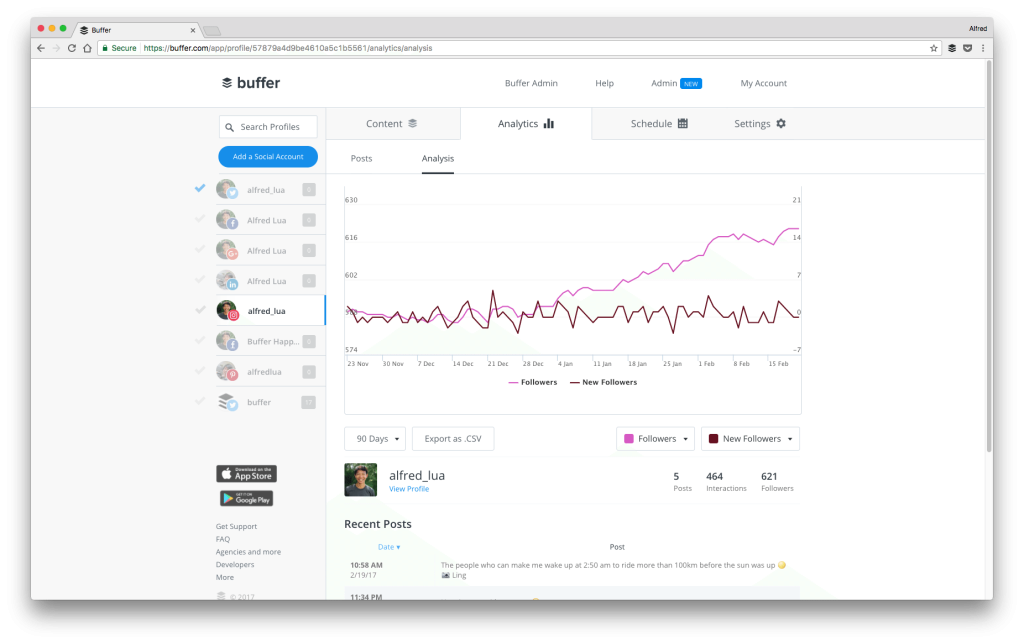
Why it’s useful: In the context of an ongoing social marketing or influencer campaign, a positive follower growth rate probably indicates that people are liking the particular posts and Stories they’re seeing and are eager to see more of them. On the other hand, a negative rate points to problems in content strategy and/or promotion.
Benchmarks and considerations:
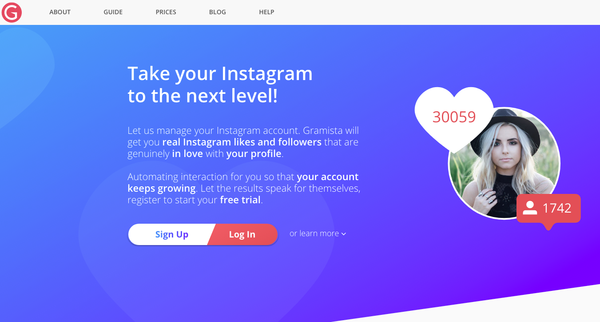
Sustained follower growth is typically a good sign that a brand’s Instagram content is reaching and building an audience. But total follower count by itself, in isolation, is something of a vanity metric, as followers can be bought to create a false impression of an account’s popularity. This screenshot of Gramista, an Instagram automation service, shows how easily follower counts can be inflated.
Any evaluation of follower growth or decline should be contextual, which is why it’s important to track fluctuations in follower count alongside the durations of specific campaigns to see what might be causing them.
- Was there a big spike after an ad campaign?
- Or a significant dropoff when a post fell flat or offended its target audience?
- Are more people leaving in response to a change in posting frequency?
Some degree of follower churn is inevitable, and like we said, a high number of followers doesn’t necessarily imply that an account is doing well.
Highly engaged followers are more likely to act on what they see.
By putting follower growth into the context of campaigns and also measuring concurrent changes in engagement, social media managers can better see if they’re creating engaged followers.
Highly engaged followers are more likely to act on what they see.
Some proven techniques for creating more engaged followers include working with influencers who already have trusting audiences and taking advantage of longer, well-written captions that increase the amount of time someone spends with a post.
This National Geographic post uses long captions, hashtags and mentions of other accounts to maximize engagement and attract new followers.
5. Profile views and referral traffic
What it is: The number of times users visited a brand’s profile and clicked on the hyperlink embedded into it. Clothing retailer American Giant’s page has a typical link setup in the bio (annotation added):

Why it’s useful: Instagram is not an e-commerce platform per se, but the massive number of impressions it can create means that it’s an integral part of the sales funnel for many organizations. A brand’s profile page is the only location on the platform that it can include a fully clickable and exposed URL, which in many cases leads to a landing page where someone might be converted. Tracking this traffic helps measure progress in how user engagement is translating into website visits and sales.
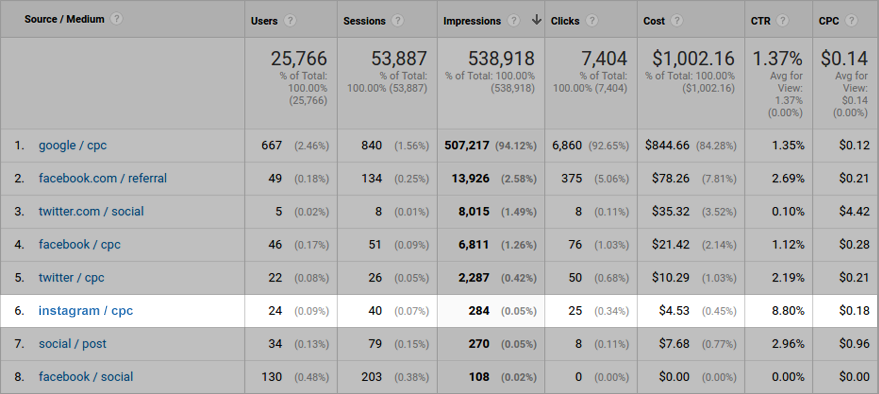
Benchmarks and considerations: Instagram referrals from bio links can be fully tracked in Google Analytics, using UTM parameters in the destination page(s):
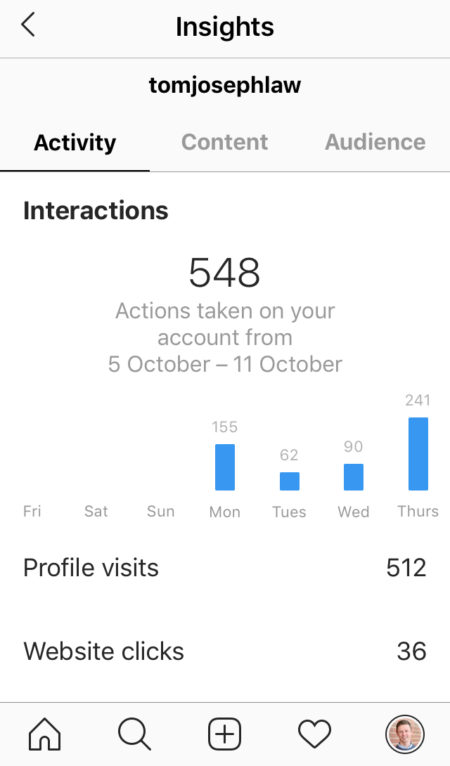
Meanwhile, a simple breakdown of profile visits and website clicks can also be viewed in Instagram Insights:
There is no universal benchmark for how many such visits clicks an Instagram profile should create. Nevertheless, a highly engaged Instagram followership can generate a flow of qualified leads to a website.
To maximize the efficacy of a bio link, it might make sense to create an Instagram-specific landing page. These pages are also useful as destinations for Instagram’s action buttons that let business accounts add specific actions to posts, such as this “Learn More” one that directs to a special Wall Street Journal subscription offer:

Its corresponding landing page looks like this:

6. Popular Hashtags
What it is: Hashtags are words or phrases preceded by an octothorpe (aka the pound sign). Clicking on one will show a user the posts in which it has been applied. This Delta Air Lines post includes numerous hashtags:
View this post on Instagram
When a city makes you want to dance, you know it’s special. Photo: @brahmino
Why it’s useful: Hashtags give users a universal term to search for, allowing them to bypass Instagram’s algorithmic recommendations to consistently find specific content they’re interested in. For brands, effective use of hashtags can substantially boost engagement and widen their audiences, since it lets them reach not only current followers but anyone who’s tracking the used hashtags.
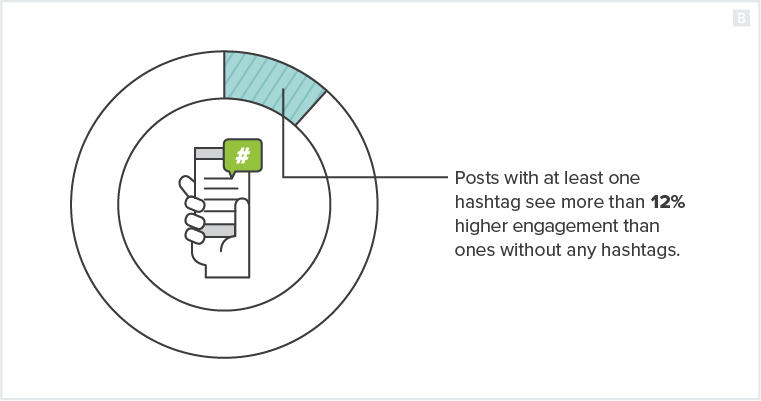
Posts with at least one hashtag see more than 12% higher engagement than ones without any hashtags.
Benchmarks and considerations:
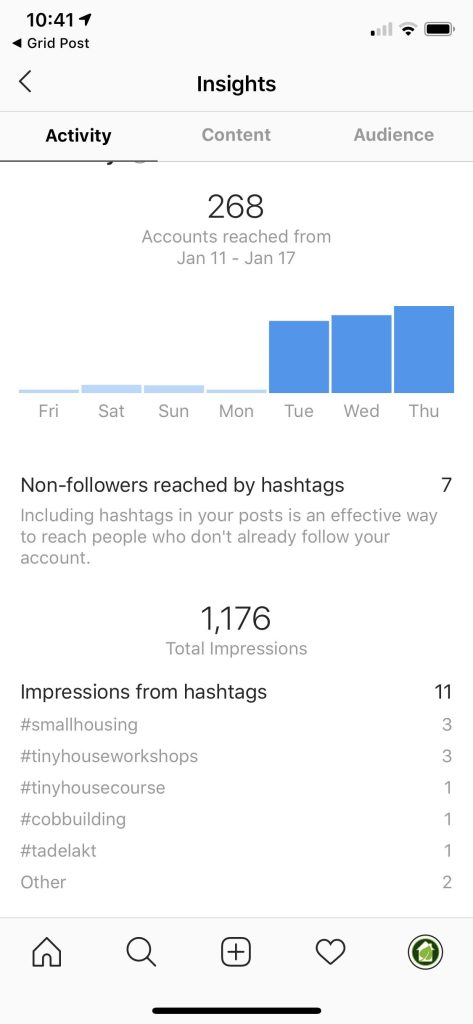
Instagram Insights and various third-party tools allow for hashtag performance tracking, which may show how many non-followers were reached via hashtags and which hashtags created the most impressions:
Depending on the tool, it may also be possible to compare relative hashtag performance using graphs. Owlmetrics makes this easy:

Knowing this context, on top of what can be gleaned about hashtag reach to non-followers, can help brands set benchmarks for hashtag success and weed out any that don’t show acceptable results.
Instagram limits each post to 30 hashtags.
Be mindful of hashtag hijacking, too.
Baking company Warburton’s once used the hashtag #CrumpetCreations in its Instagram campaigns without realizing it was a popular hashtag in the furry community. As a result, anyone searching for the brand’s content with that hashtag instead saw posts mostly about cartoonish animal costumes.
7. Instagram Stories analytics
What it is: A collection of metrics about an Instagram Story, i.e. a slideshow of photos and/or videos that stays live for only 24 hours. This example shows some of the specific analytics, including replies and profile visits.

Why it’s useful: Instagram Stories are incredibly popular, having already surpassed Snapchat Stories in the number of daily active users and become one of the most common ways to share ephemeral content:

Plus, Instagram Stories are highly interactive, as brands can add links that can be accessed by simply swiping up from an active Story if they have at least 10,000 followers. Knowing the metrics on replies and profile visits is useful for gauging the success of Story design and whether a Story is fueling the conversion pipeline.
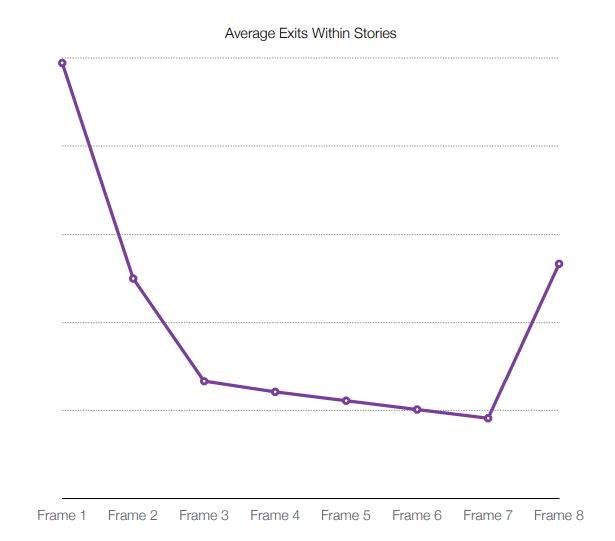
Benchmarks and considerations: Average reach for Instagram Stories varies by industry and averages out to 7.2% of followers, as per this report from Delmondo:

The first few frames of the Story are key, as engagement plummets as time goes on:
Shorter Stories can usually maintain more sustained attention, but long ones can work as well if an audience is interested in the content. Accordingly, the best approach to designing an Instagram Story will depend on a brand’s line of business and audience demographics.
Building a better brand through Instagram metrics tracking
There are many Instagram metrics we haven’t covered here, but the seven above constitute a representative cross-section of the range of simple and complex analytics that can be used to evaluate performance.
Collecting and reviewing all of these Instagram analytics is relatively straightforward, since one tool – Instagram Insights – is free to use with an Instagram account, while others like Google Analytics for referral traffic are free and multi-purpose.
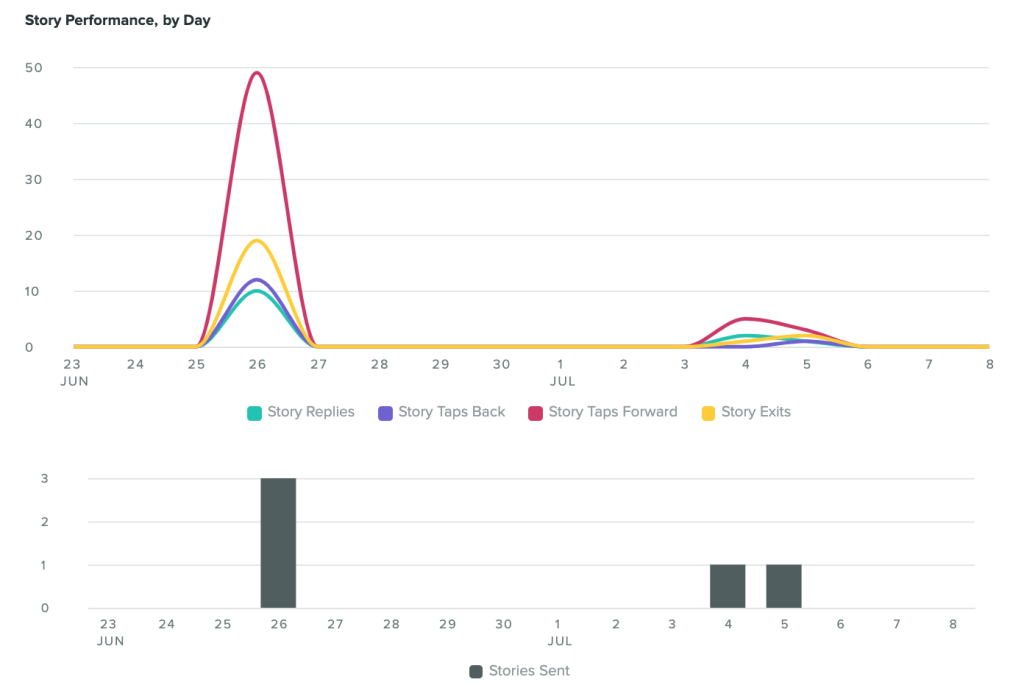
Paid solutions may also be useful for the extra nuance they can provide, such as this detailed chart on Story performance from Sprout Social:
A brand’s preferred metrics will ultimately vary depending on the types of social media and/or influencer campaigns it’s currently running. But it’s essential to keep tabs on performance in some capacity to know if Instagram outreach is working and, if not, what might be done to get it back on track.