

Welcome to the latest edition of Web Analytics Monday, where we break down complex Google Analytics reports into actionable insights.

Today we are going to dig into the demographic profiles of your visitors. Yep, you can create personas using Google Analytics! So let’s squeeze some of the juice out of this tasty feature.

Know thy audience
So what are Demographics reports, anyways?
Google Analytics rolled out a feature a few years ago that allows GA accounts to collect data on visitors’ age, gender, affinity categories and in-market segments. GA collects this data from third-party DoubleClick cookies, Android Advertising IDs and iOS Identifier for Advertisers (IDFA). You don’t need to know what any of these things mean – you just need to understand that GA is collecting a creepy amount of anonymous data.
I find the most value in segmenting against age and gender, so we are going to stick with those two for now.
Enabling Demographics
First you need to start collecting data, so go to the Admin Panel → Property Settings, then click “Enable Demographic and Interests Reports.”
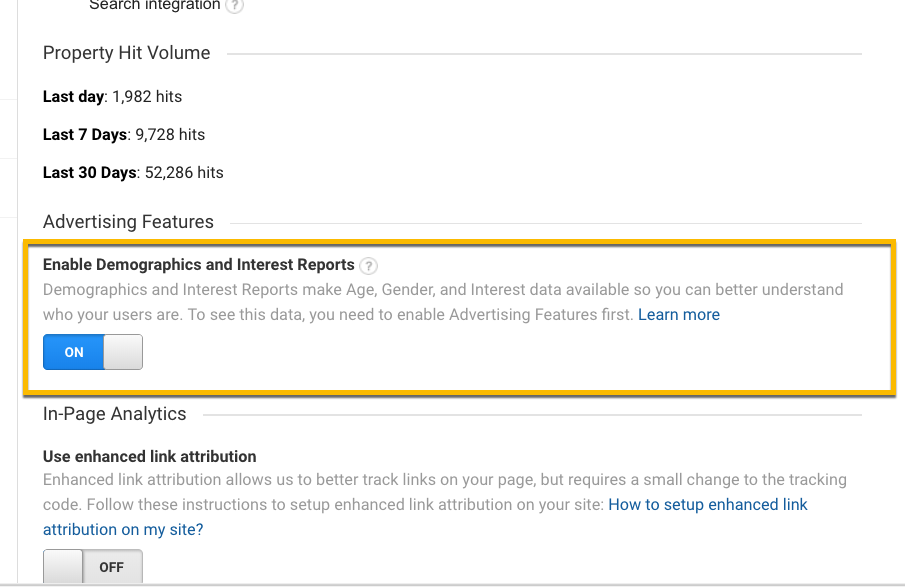
Once you enable this feature you will start collecting data (it’s not retroactive, unfortunately).
Exploring the Reports
Now it’s time to start having some fun. Navigate to Audience → Demographics → Overview. GA will populate a couple graphs that look like this:
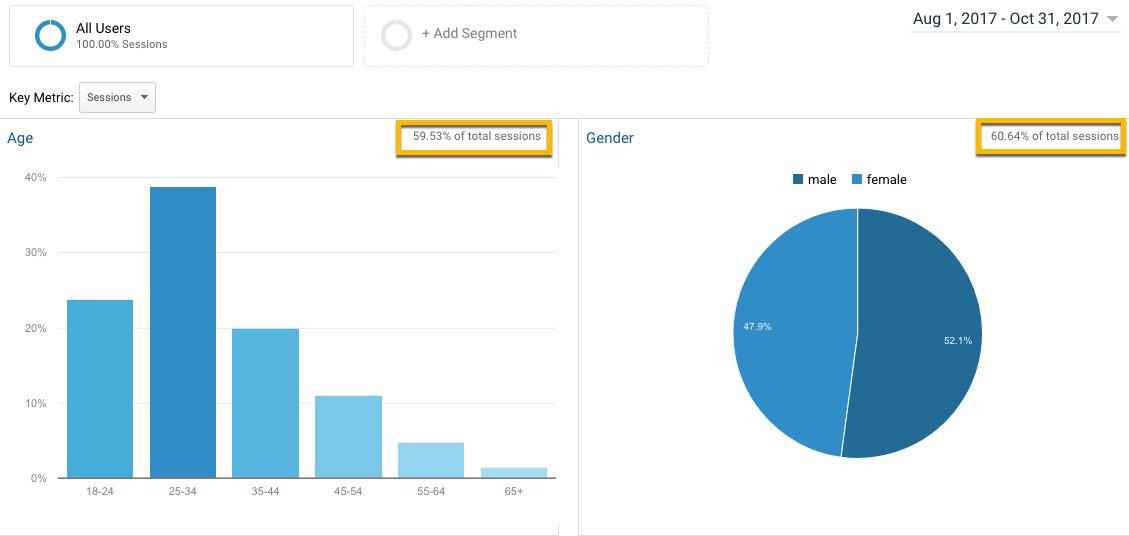
Note that the data is incomplete, reporting only 59.5% and 60.5% of age and gender sessions. GA can’t pull data on all your site’s visitors; that’s okay. We are only looking for trends and behavior in order to generate insights – we don’t need complete data to do that.
In the left hand column, click on “Age” to build a report. Your screen should look like this:
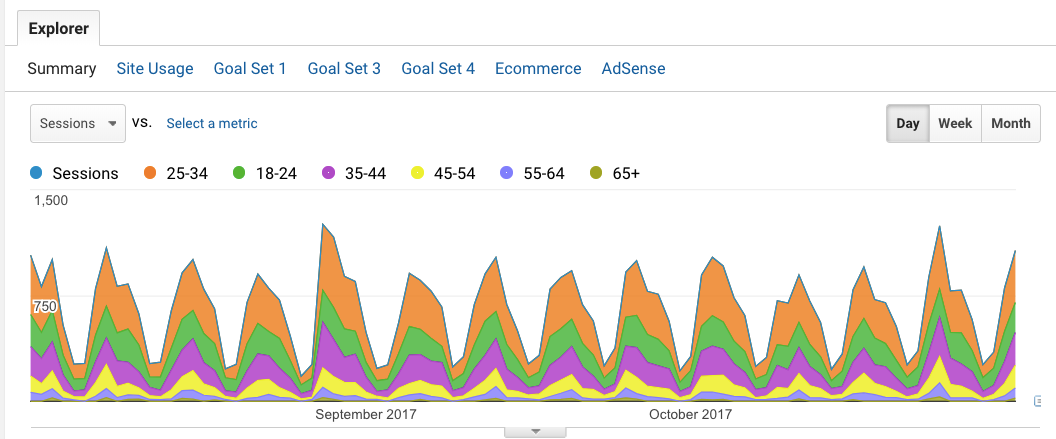
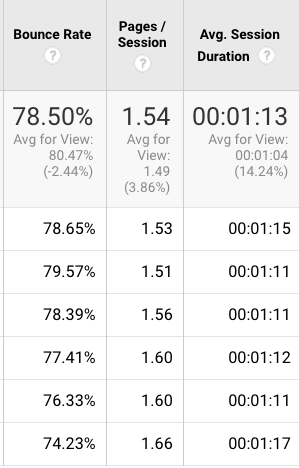
Very colorful! Next we want to get an understanding of the age groups that visit our site. Take a look at the table below to see if we can tease out some insights.
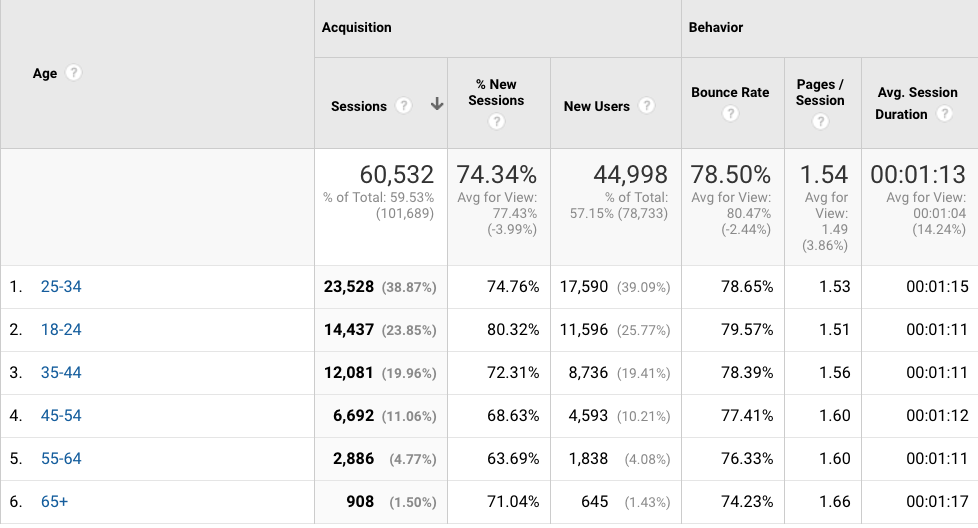
Now we are getting somewhere! The data shows that our primary audience (39%) is between the ages of 25-34. A younger audience between 18-24 lags behind significantly at 24% of all traffic. Note that every age group has similar engagement behavior:
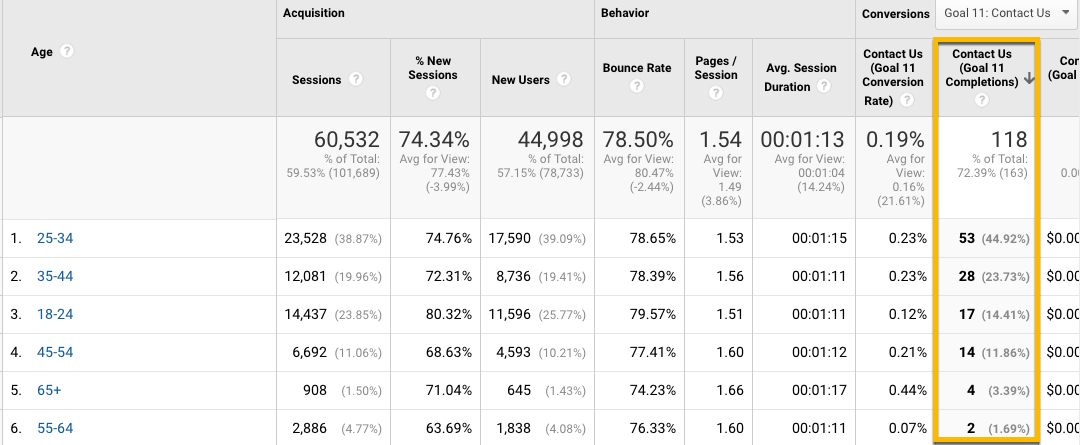
Now for the million dollar question: Who is generating the most commercial value out of our segments? I’m going to use the Goals dropdown and select our most significant macro goal, “Contact Us.” These macro goals represent visitors who send contact information with the intent of learning about our services.
Taking a closer look…
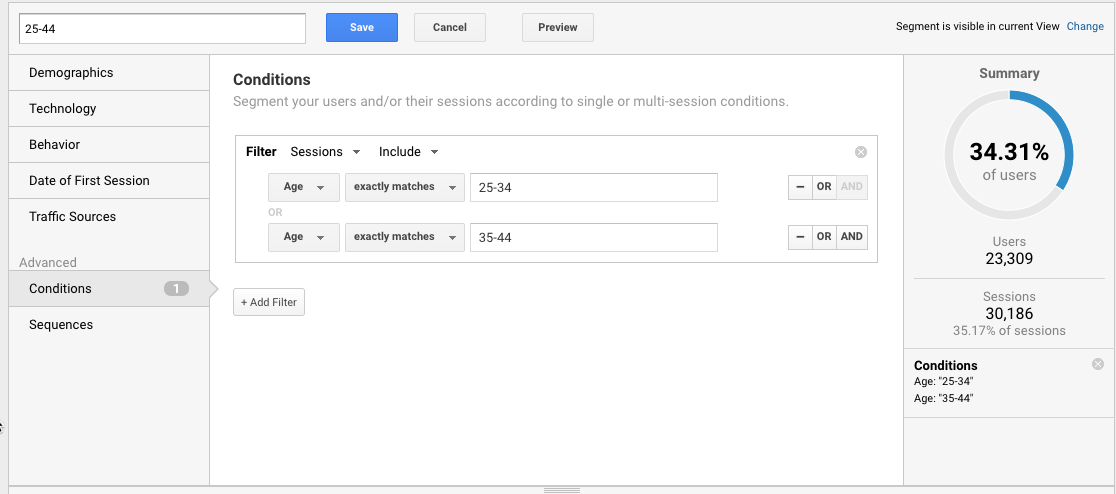
69% of all commercial objectives are generated from our 25-44 aged visitors. Now we want to learn a few more things about this group: here they are coming from and which pages they are landing on. For this, we’ll create an Advanced Segment. Go to the top of your screen and click “New Segment.”
Name the segment, then click on “Conditions” and type in “Age.” Select “exactly matches” 25-34 OR 35-44.
Click “Save” and you will be brought to an overview report. Any report we look at will show data exclusively for our age group. Now go to Behavior → Site Content → Landing Pages. Then sort by conversions.
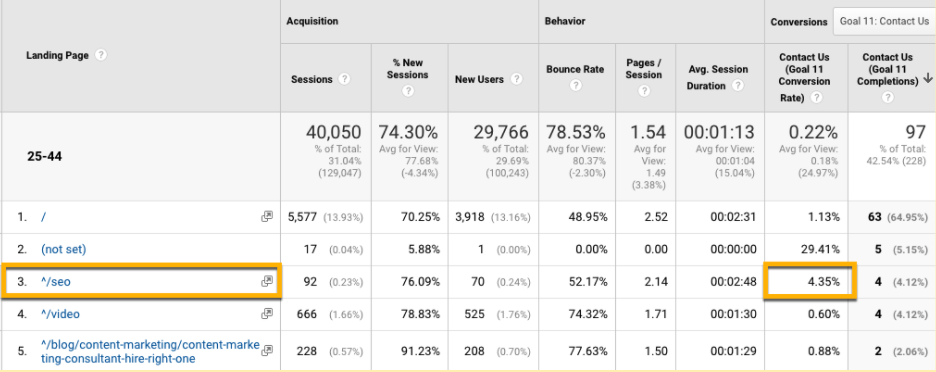
This particular page, while only driving 0.23% of traffic from this audience, converts at 4.35%, almost four times better than the homepage! We now know that the search terms targeted on this page and the user experience are dead on. We need to replicate this experience and take lessons from our keyword research across other landing pages.
Let’s talk about gender!
Don’t get caught assuming men and women are going to interact with your site exactly the same. They aren’t. And this is especially true if you are in the B2C space. We want to understand the proportions of men and women that visit your site, how they behave and how often they convert.
Go to Audience → Demographics → Gender.
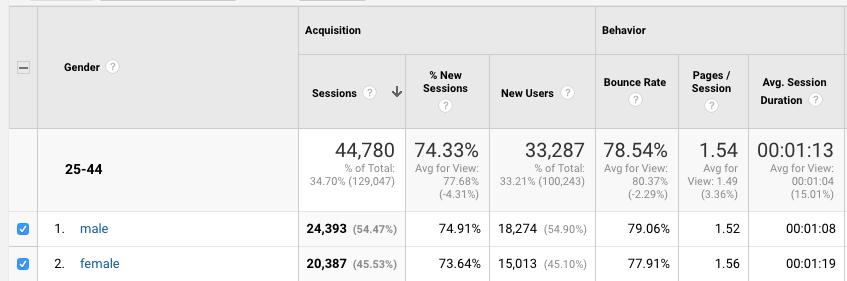
Our site skews slightly toward more male visitors than female. However, both genders engage in almost identical fashion. And they both convert at the same exact rate:
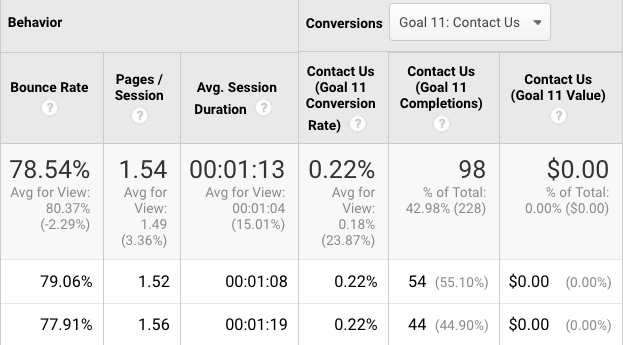
So do we treat them the same way? Not exactly. When toggling down to micro conversions (newsletter subscriptions), we see vastly different behavior.
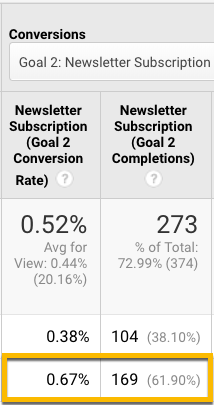
Women subscribe to the blog at nearly double the rate men do. We need to address how we are speaking to the female audience in ways that we are not speaking to the male audience.
What did we learn?
The number one takeaway from today is that you cannot assume to know anything about your visitors until you really crunch the data and tease out actionable insights.
Join us next week for another edition of Web Analytics Monday!