

At any given time, a brand might have an email drip campaign, a social media strategy, paid search ads and a variety of SEO-targeted pages. All of these channels work to increase traffic to your website.
But how can you tell which ones are bringing you the most traffic? Or where people from each channel end up on your site?
The ability to answer these questions gives you invaluable insight into how your audience responds to various messages through different channels, and should hint at how to adjust your overall marketing strategy for success.
Here, we’ll look at how to use Google Analytics and Google Search Console to attribute website traffic to specific:
- SEO campaigns.
- PPC campaigns.
- Email campaigns.
- Social media campaigns.
Note: This guide was shared as a resource for our video course, Define Your Target Audience in 6 Days. There’s also a video walk-through of the following steps here:
For more details on how to use the information the methods in this guide will uncover, enroll in the course here:

Attributing SEO campaign website traffic
An SEO campaign targets specific keywords, aiming for specific landing pages to appear in search results for that query and related queries.
The best resource for attributing traffic to specific keywords is Google Search Console. The data that comes through Google Analytics for this can have holes in it, leaving you to guess at what’s really going on.
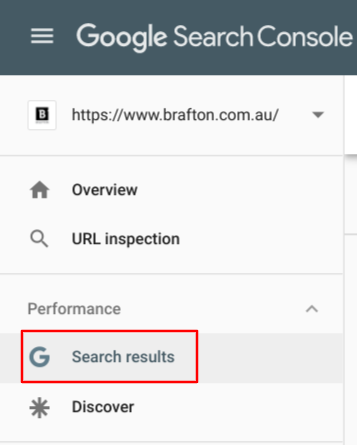
Open up GSC, and go to the Search Results section under Performance:
A line graph and table will automatically load, showing you the keywords that people used to find your site. To look at specific queries, click the “+ NEW” filter button at the top, and select “Query.”
In the drop-down, select “Exact Query” and type in your target term – I chose “social media marketing.”
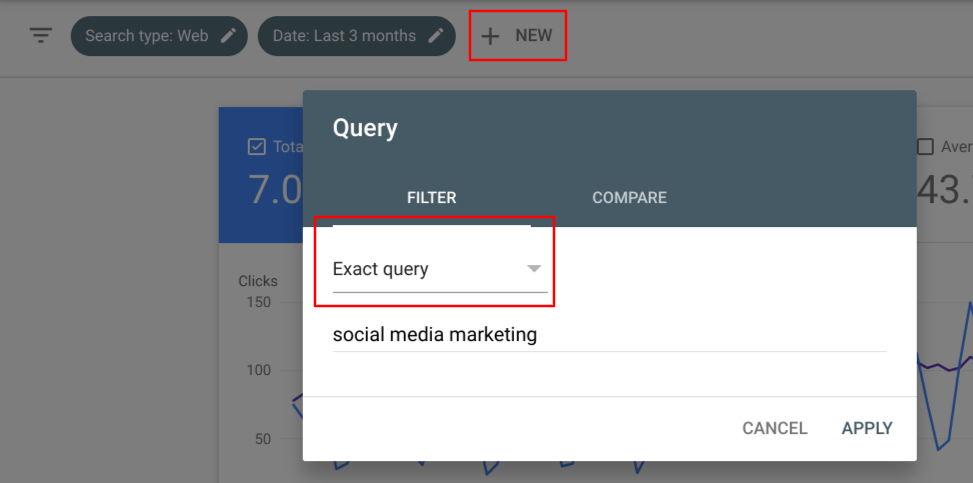
Hit APPLY, and the graph will update to show how well your site is performing in search for that term.
Scroll down to the table beneath the graph and click on “Pages” at the top. This will show you the landing pages that show up in search for that query. Click on the page that’s intended for that target term.
Now, your graph is showing you how that specific page is doing in search for that specific query.
Finally, set your time frame to the date range of your campaign. If it’s ongoing, set the end date to yesterday’s date.
In the top right corner of the table, you’ll see Total Clicks. That’s the organic traffic that you can attribute to that keyword-landing-page combination.
To attribute traffic to the next 3 types of campaigns, we’ll use Google Analytics. Take these two preliminary steps to begin attributing traffic to specific channels:
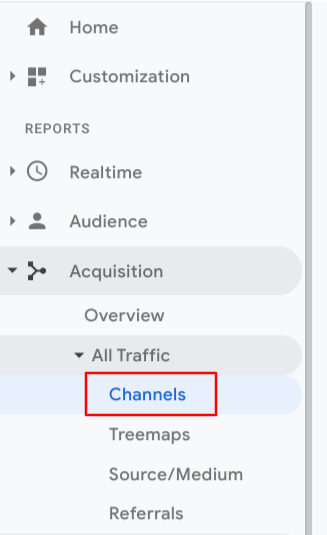
1. Log in to your brand’s Google Analytics account and go to Acquisition, All Traffic and Channels.
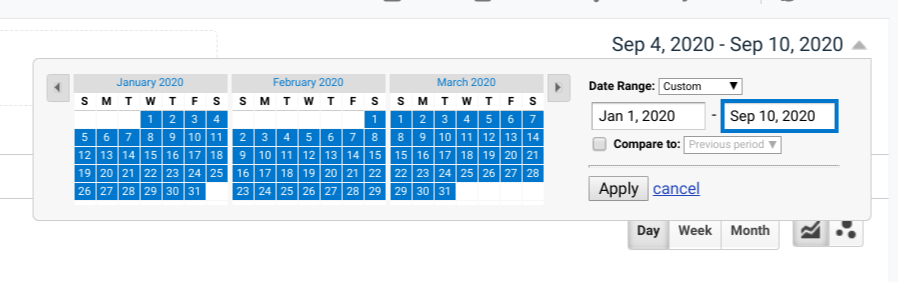
2. Spread out your time frame to include the full span of the campaign(s) you’re analysing. If the campaign is ongoing, set the end date to yesterday’s date. (I don’t even look at the tables or charts before I do this. I either get too excited or too worried.)
The next steps depend on the type of campaign you’re analyzing:
Attributing PPC campaign website traffic
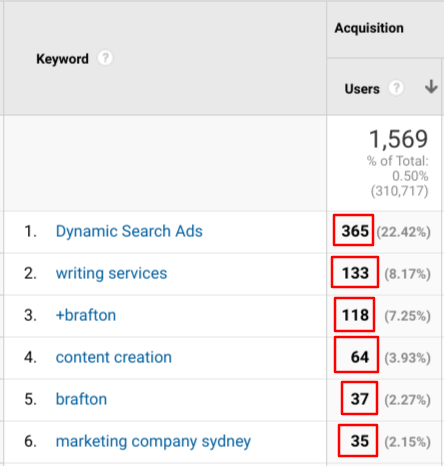
PPC campaigns also target specific keywords, and the data in Google Analytics can generally be trusted for this.
Once you’re in the All Traffic/Channels section, a table will populate with the various channels by which people will reach your site.
Click on the blue Paid Search link. The total number of users associated with your PPC campaign term(s) is the traffic volume you can attribute to those campaigns.
Attributing email campaign website traffic
Go back to the Default Channel Grouping table by clicking on ALL in the top left corner of this view:
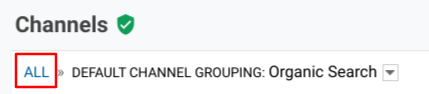
If you only have one email campaign running, just use the number in that row in the Default Channel Grouping.
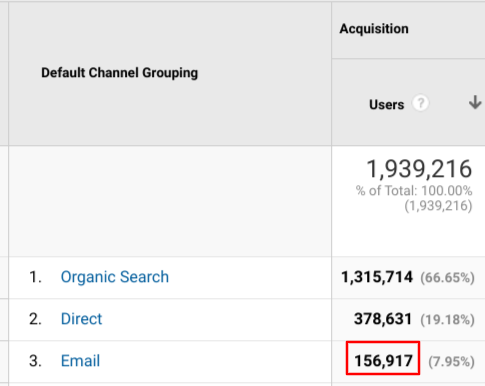
If you’re like us, you’ve got more than one email campaign running at a time. Click on the blue Email link to get details.
The default view is Landing Pages, which doesn’t tell me much, because we’re often emailing out resources that are also easy to find in search and through social media. So, I always change the Primary Dimension to Source.
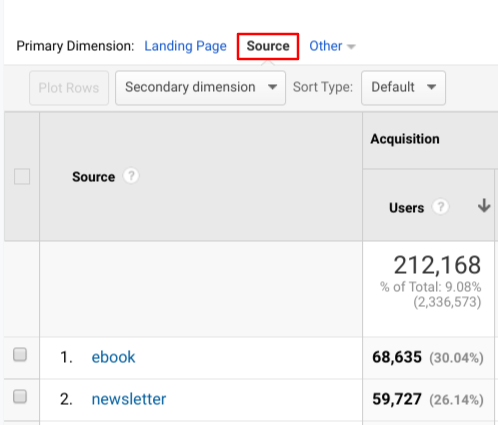
Find the source that’s associated with your campaign. The number of users for each source represents the traffic associated with it.
Here’s how GA knows when the source is an eBook launch or an email newsletter or something else: UTM codes! Make them with this tool: Campaign URL Builder. Here’s how I typically fill mine out:
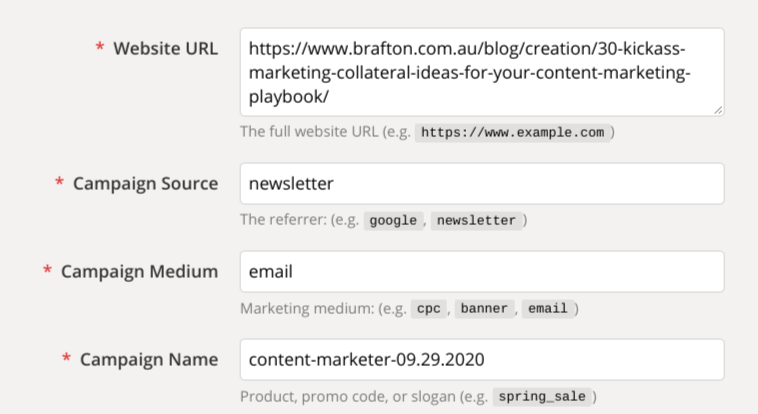
The Campaign Source is what populates in the table we’re looking at in GA.
I like to put something specific about that email in the Campaign Name, too. If you’d rather look at this information, set the secondary dimension as “Campaign” instead.
What you’re looking at here is what I use for our newsletter, The Content Marketer – this is for the edition I sent out on Tuesday, Sept. 29.
Attributing social media campaign website traffic
Social media traffic is notoriously hard to track accurately, but UTM codes are a good solution for this, too.
Back in the Default Channel Grouping view, click the blue Social link.
You’ll see every social network that’s driving traffic to your website, and they might not all be the traditional channels like Facebook and Twitter. I see Disqus, Glassdoor, Pocket and a few other sources that I wouldn’t initially think of when I think of “social media.”
We’ll just look at one social network at a time, though. Click on one where you’re running the campaign you’re analyzing. Then, add in “Campaign” for the secondary dimension to see traffic broken out by the campaign names you chose when you created your UTM codes.
If nothing populates, or you know that you’re not looking at the full picture, try this: Go back to the Default Channel Grouping view and click into (Other). Like I said, social media traffic is really hard to track accurately, and it’s possible that Google Analytics miscategorised the website visitors who came through social.
The primary dimension should default to Source, which is what you want. This is also defined by the UTM code parameters you chose.
Again, add Campaign as the secondary dimension. Now, you should see the campaign names you defined in your UTM code parameters. Find the campaign name you’re tracking, and record the number of users associated with it in the Website Traffic column in the worksheet.
Tips on setting UTM code parameters for social media:
- Campaign source: Set this as social or social-media so you can identify it quickly. Or, choose the platform you’re using, like Facebook or Twitter.
- Campaign medium: We set this as brafton-twitter or brafton-facebook, etc. You can also specify organic-facebook vs. paid-facebook in this section.
- Campaign name: Use specific terms associated with the campaign you’re running. Include the month, date and/or year if this campaign is similar to others that you have or will run, such as an end-of-summer sale.
Conclusion
These methods aren’t the only ways to attribute marketing success to specific campaigns, but they are a great way to get started with tracking website traffic and acquainting yourself with your brand’s web analytics patterns.
By identifying your strongest channels, campaigns and content types, you will be able to more confidently create marketing campaigns that are likely to result in increased traffic and conversions.


