

Just 39 percent of B2B marketers have a documented content marketing strategy. Only 49 percent actually measure their marketing performance. Yet 50 percent are still opting to increase their content marketing spend in 2019.
Something here doesn’t square.
The average content marketer:
- Has no strategy.
- Has no metrics.
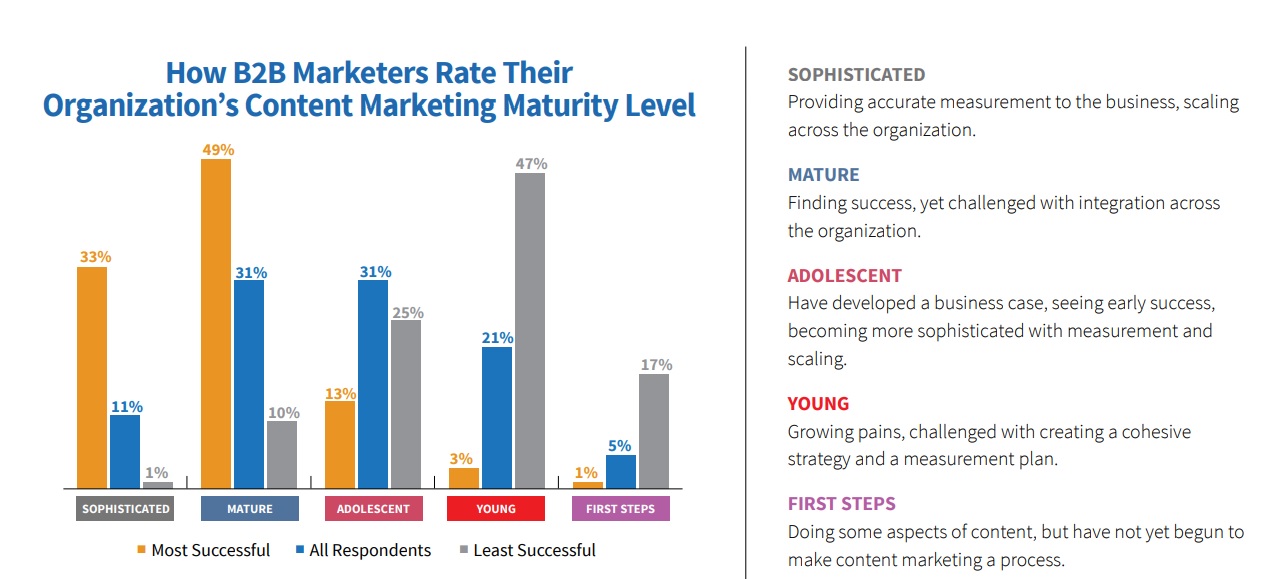
They’re also likely to categorize their content marketing maturity level as:
- Adolescent (31 percent),
- Young (21 percent),
- or First Steps (5 percent).
The numbers are similarly paltry in the B2C space:
- 33 percent have no documented strategy.
- 57 percent measure performance.
- 57 percent are increasing their spend in 2019.
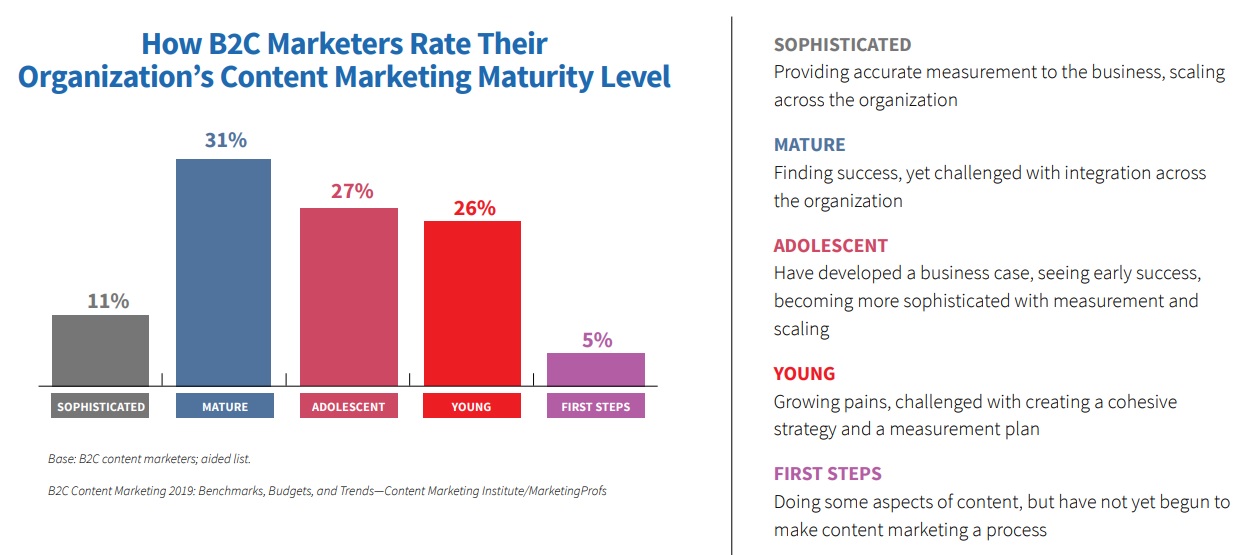
As for marketing maturity levels, we observe the following:
- Adolescent (27 percent),
- Young (26 percent),
- or First Steps (5 percent).
So, the naked truth is that brands are pumping more money into content marketing with little idea why. They know they’re supposed to do content marketing, but they have no core data to dictate their resources, tactics and overall spend.
Well, kudos for investing in content marketing in the first place – you’re on the right track. But shame on you for doing it so blindly.
There’s one way to drive content marketing ROI in 2019, and that’s through data.
We’ll show you what that looks like.
Data for strategy
First and foremost, what are your big-picture business goals? Secondly, how does your marketing strategy feed into those goals?
Your content marketing strategy should be able to meet the KPIs you set at the department level. But you should also be adept at translating marketing-specific data points into high-level corporate speak, too. That way, executives, sales and other teams know how to interpret your successes.
You can divide your data into micro and macro goals, or conversions. We would suggest looking at factors along the lines of:
Micro
- eBook or white paper downloads.
- Newsletter subscriptions.
- Social media shares and engagement.
- Backlink accrual.
- Email forwards.
- Email opens.
- Product video views.
Macro
- Demo requests.
- Visitor outreach to sales (through email or phone).
- Adding an item to an online shopping cart.
- An on-site purchase.
- Quote request.
- Accepting a pitch or proposal.
You’ll need a system in place for tracking this information in real time, measuring it against benchmarks and reporting on it to other teams. This will likely include a combination of marketing automation software, Google Analytics and a few manual inputs.
In our 2019 State of Content Marketing Report, we outline the top marketing tools and platforms you need to leverage data in every cog of your content operation.

With the above information, you can flesh out the goals you want to achieve in the near and long term, and how they can be achieved through specific strategy decisions.
For instance, more macro conversions would require more bottom-of-funnel assets. Or, more backlinks would require organic blogs and in-depth research.
Data for audience targeting and planning
Conceptually, you may have the blueprints for content marketing success, but mapping your ideas and tactics to actual prospects is a different beast. That’s where buyer personas and behavioral segmentation enter the conversation.
Personas
Divide your target audience into three to five personas. These readers each have their own unique characteristics, motivations, purchasing power, personal habits and subject matter expertise.

For example, we determined that our core site visitors are not the same as our buyers. Oftentimes, a marketing manager or lower-level staff member will visit our site and sign up for our email newsletter. Then they forward that information to their boss. Said boss (often an executive or director with the authority to sign contracts) will contact us for a phone call and proposal, and then we proceed with a contract if all parties agree.
This is very typical of most B2B organizations.
As you can see, if we wrote all or most of our content geared toward an executive audience, we’d be skipping ahead multiple steps in the buyer journey. You need the following data points to produce content intended for the correct audience:
- Age.
- Location.
- Job title.
- Sex.
- Personal/professional interests.
- Position within company hierarchy.
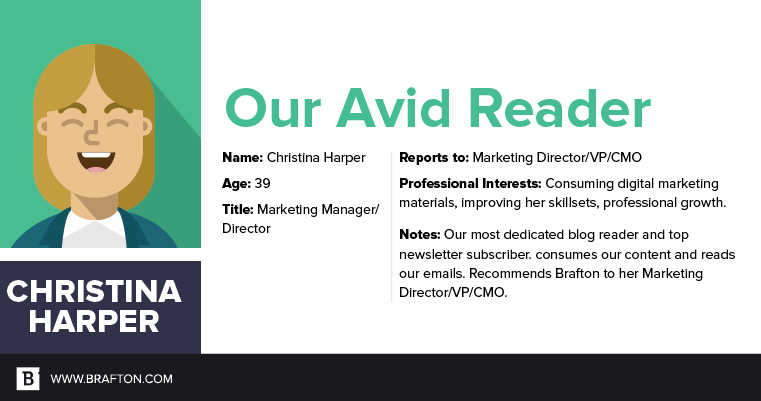
Here’s a formatted persona of whom we deem “Our Avid Reader”:
Segmentation
If you’re in the B2B space, and especially if you’re following an account-based marketing model, you’re going to be targeting clients at an organization level. This means you need additional data points on the company as a whole, what are called “firmographics.”
Those might include:
- Location.
- Structure (LLC, nonprofit, etc.).
- Number of employees.
- Performance (growth rates, profits, etc.).
- Industry.
Digging deeper, you can segment your target audience by their precise behavioral patterns, such as:
- Time to purchase.
- Desired vendor relationship.
- Reason for purchase.
- Level of technical support required.
- How purchasing decisions are made.
For more information on segmenting your B2B audience, check out this recent post.
Quick note: Data from your existing customers is also helpful to have. Think satisfaction rates, online reviews, repeat purchases, etc.
Data for content ideation and creation
Knowing what to create, the point in the funnel to focus on and whom to target, you can now brainstorm topic ideas and actually produce your marketing assets.
The days of easy content marketing are far in the past, and 90 percent of content fails to achieve its goals.
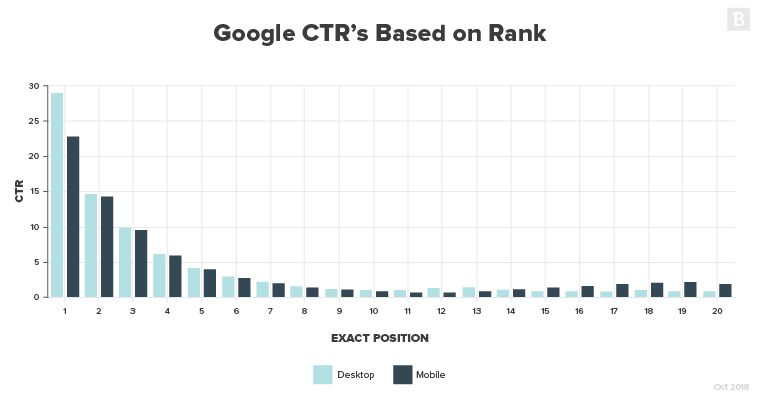
About 86 percent of all clicks occur on page one of Google; about 62 percent on the first three positions, in particular. So if your organic content doesn’t rank in the top three in Google for a specific keyword, you may have wasted your money (if the goal was organic ranking).
Here are a few factors to consider to ensure your topics and projected performance are optimized:
Keyword research
Use a tool like SEMrush to determine a seed keyword. Each web page you create should be focused on one single target keyword. Use the following metrics to choose the right one:
- Organic keyword difficulty.
- Search volume.
- SERP crowding/SERP features.
Then you can use Google Trends to determine:
- Search popularity over time.
- Trending topics and seasonality.
- Geo- and industry-specific search popularity.
Next, give the existing Google SERP for your target keyword the ol’ manual eyeball test. What is the search intent of the query and how is the current SERP serving it? This will determine whether your content should be informational or commercial in nature.
Content gaps and re-optimization
Writing about a topic authoritatively is as much a science as it is an art. While you know what to write about, you also need to know how to write it and how long it should be.
That’s where tools like MarketMuse or SEMrush’s SEO Content Templates help.
They will let you know where the gaps are in currently ranking pages, and how you can incorporate them into your own content to ensure you’re covering every piece of information a searcher may need. You’ll also be given a suggested word count, which is often the average word count of the top 10 or 20 results for your keyword. Some marketers refer to this next-level exactitude as content intelligence.
This process works when you re-optimize your own content as well. If you don’t want to invest in content creation from scratch, optimize your existing pages first. Start with those that are on the cusp of ranking on page one: positions 11-13, for instance. Even a marginal improvement in content quality can push a blog post onto page one, resulting in an exponential amount of more organic traffic to your site.
As HubSpot’s Alex Birkett put it, “ … content optimization is an underrated way to unlock additional ROI and revenue. So if you’re almost ranking for a term, lifting that to the first page of Google is often cheaper and easier than writing a net new posts.”
Data for distribution and promotion
Content that lives only on a website is akin to keeping a racehorse locked in the stable.
You need to distribute your content through various channels to realize the full performance of what you’ve created. Email and social media are nonnegotiables – you must be active on these channels.
Social media
LinkedIn is home to 40 million B2B decision-makers, 94 percent of whom state LinkedIn is their most effective distribution channel. Furthermore, 80 percent of all B2B leads come from LinkedIn. All of this is to say that, you need to publish and promote your content on social media not just for engagement and amplification but for actual leads.
For B2B companies, that means LinkedIn. For B2C, it’s often Instagram and Facebook.
Email marketing
Email drives the most leads, generates the highest ROI and brings in the most revenue of any distribution channel. If that doesn’t get your attention, we don’t know what will.
Sending out your content through email campaigns automates your distribution, lead gen and brand awareness. And there are a multitude of campaign types to choose from, including:
- Newsletter.
- Drip.
- Lead nurture.
- Prospecting.
- Promotional.
- Educational.
- Re-engagement.
The user data from your sales and customer-service teams can be combined with the data from your marketing team to form a potent concoction of specificity, ensuring your content is being sent to the right people at the right time.
If you’ve been sending out the same boring newsletter the past four years – and nothing else – you’re severely limiting your distribution ROI.
Data for performance metrics and measurement
We touched on this above, but, data-driven content strategy needs a steady stream of actionable data – at all times. That’s the only way to convert these insights into engaging content.
So here are a few content performance metrics to measure, all of which can be found in Google Analytics, SEMrush and BuzzSumo:
- Organic position.
- Bounce rate.
- Dwell time.
- Social shares.
- Monthly traffic.
- Traffic sources.
- Conversions/Goal Completions (these are custom created to be whatever you want).
- Sessions/Pages per Session.
- Avg. Session duration.
- Referring domains.
- Traffic cost.
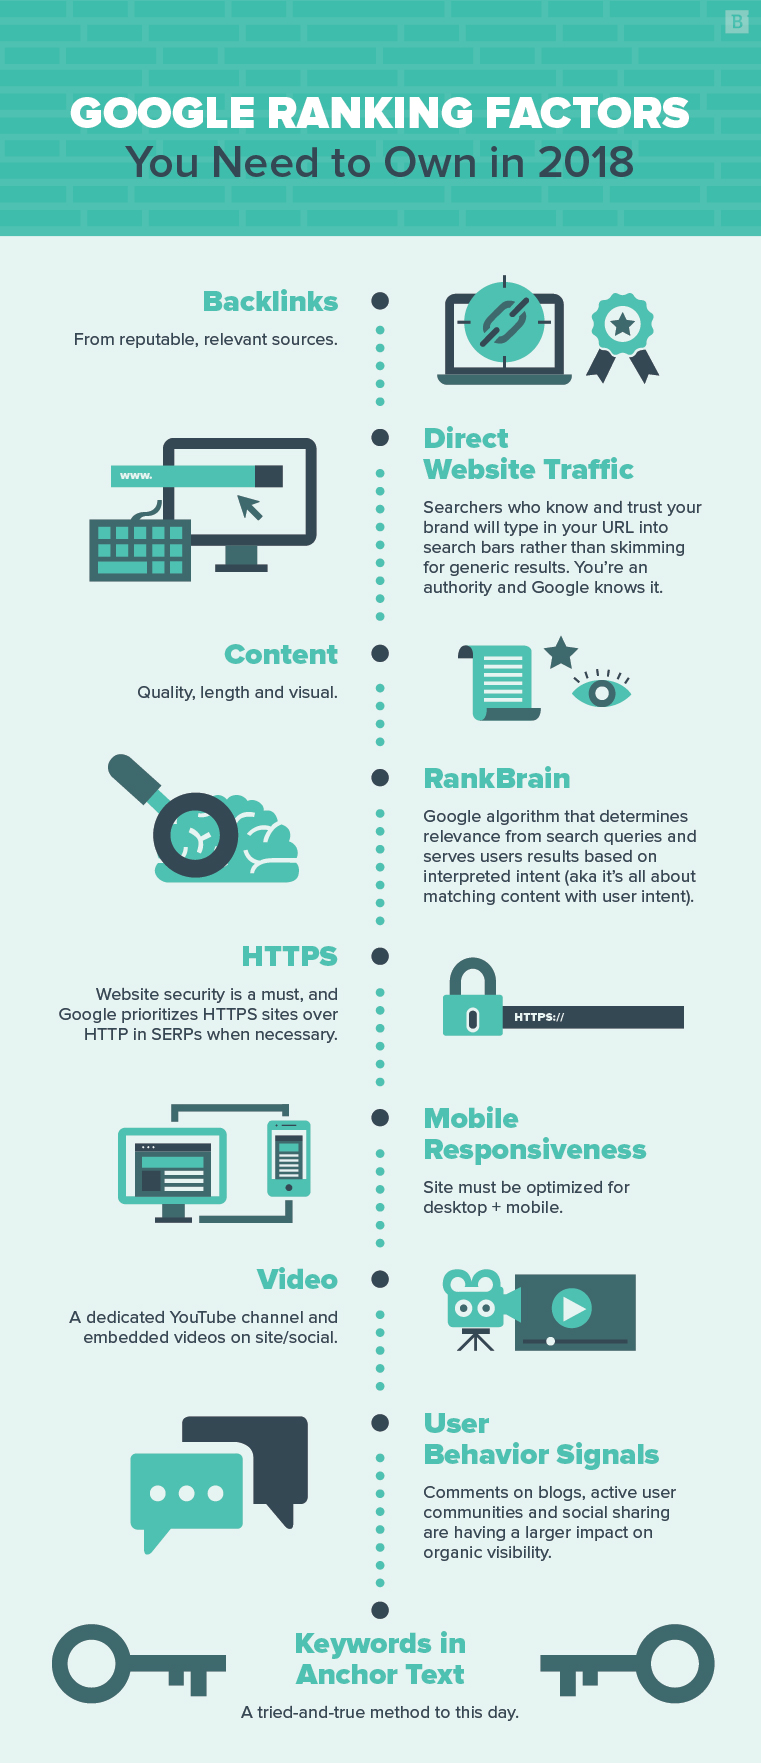
Your data should also be geared toward keeping pace with Google’s ranking factors, which can be found in this infographic:
Enrich your marketing
Content marketing must be done correctly or not at all. The web is already littered with pages that receive no traffic or links – it’s a dumpster.
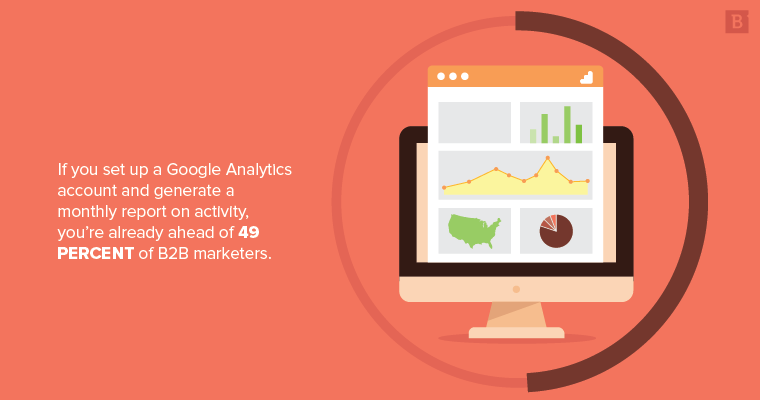
But by putting data at the forefront of every decision, you can replicate previous successes, prevent dead-on-arrival content and stay ahead of competitors. Going back to our first statistics about measurement and tracking: If you set up a Google Analytics account and generate a monthly report on activity, you’re already ahead of 49 percent of B2B marketers.
Just think how far ahead you’d be if you broadened your analytical capabilities to every component of your marketing.
In 2018, we embarked upon an ambitious data-led marketing campaign, and the results were astounding:
- 70 percent of our product landing pages now rank on page one of Google.
- Organic traffic increased 75% year over year.
- 43 percent of new blogs landed on page one of Google.
- The total number of keywords our domain ranks on page 1 for increased 161% year over year.
These successes can be replicated. And it starts with data.


