

Think you have a better attention span than a goldfish? Think again, pal.
Year after year, people’s attention spans have gotten shorter and shorter, reaching their nadir in 2015, when humans officially surpassed goldfish on the shortest attention span list. The lowly goldfish loses interest in 9 seconds, whereas we highly evolved creatures can only hold our attention for 8 seconds before getting distracted.
You can thank the ever-increasing number of media platforms for our dwindling ability to concentrate. Smartphones, the internet and social media networks have all pulled our attention in different directions, resulting in a complete and utter inability to focus on any one thing for very long.
The obsession with PageSpeed
With that in mind, pagespeed should be of the utmost importance to marketers. If your site is slow to load, visitors lose interest and go elsewhere. Even if they stick with it and wait for your site to load, you’ve already taken a direct hit in the user experience battle. People expect fast, responsive web and mobile sites, and if you can’t give it to them, you’ll lose their respect.
It’s no wonder that so many marketers fret over their PageSpeed score and agonize over getting the highest grade possible. Tools like Google’s PageSpeed Insights are a handy way to quickly gauge how fast your website is for both desktop and mobile platforms.
However, by focusing too much on raising the raw numerical value, you may lose sight of the underlying issues driving those scores and how they affect the user experience.
Know your PageSpeed options
One of the most glaring reasons to not put too much stock into any single PageSpeed score is that there are so many tools out there and your results may vary significantly from one to another.
Let’s do a quick rundown of the top dogs:

Google PageSpeed Insights
Google’s tool is, unsurprisingly, one of the most popular options available. It’s fast, it’s easy, it’s free and, best of all, it’s straight from the horse’s mouth. When it comes to site performance, Google’s word is typically treated as straight gospel. The final score provided by PageSpeed Insights is often less helpful than the actual analysis it offers, though. (We will explain why.)
Pingdom
For something a little more robust, Pingdom may be the way to go. This tool goes beyond the analysis offered by Insights, including not only how fast your site is but how that load time compares with the internet at large. For content marketers who like their PageSpeed scores with a helping of context and granular analysis, Pingdom is where it’s at. And it’s free too, which never hurts.
Webpage Test
The true analytical junkies will want to dive even deeper into the data pool. For those info-crazy content marketers, the only answer is Webpage Test. What it lacks in friendly, intuitive UX, it makes up for with a crazy level of detail assessing site performance. You can test for a variety of platforms, locations and browsers, allowing an incredible amount of customization. Want to know how your site stacks up for Linux users in Dulles, Virginia? Webpage Test has you covered.
Unlike Insights and Pingdom, this tool doesn’t give an overarching grade or score. Instead it breaks down performance by six criteria:
- Time to first byte.
- Keep-alive enabled.
- Compress transfer.
- Compress images.
- Cache static content.
- Effective use of CDN.
All in all, not the most user-friendly option, but enlightening, nonetheless.

GTmetrix
While all of those tools are nice in their own right, Brafton’s own development team swears by GTmetrix. Why, you may be asking yourself, would a dev team choose GTmetrix over a workhorse like Webpage Test? The answer is context.
GTmetrix leverages Insights and Yahoo’s Yslow tool to give a more complete view of PageSpeed performance, while providing additional analysis that fully explains why different optimization steps are necessary.
It’s important to keep in mind that any PageSpeed tool will spit out automated optimization suggestions. You need to look deeper at what those steps will accomplish to understand precisely how to obtain the best performance possible from your site. GTmetrix provides that context, where other tools may just give you advice with no rationale.
Even better, GTmetrix breaks down optimization criteria and compares your site’s performance against both the average website and one of your direct competitors.
Crunching the numbers
Your PageSpeed score can rely on a wide variety of specific metrics and criteria. Knowing how PageSpeed tools grade your site can help you understand the deeper meaning behind those results. At the end of the day, these tools are essentially automated algorithms measuring an array of metrics against predetermined standards.
What metrics do they look at? These are some of the most likely standards your site will be held to:
- Number of redirects.
- The size and duration of browser cache requests. (Fun fact: Best practices suggest this should be as long as several years. Extra fun fact: The venerable Google Analytics violates those standards.)
- Image optimization.
- File compression and limiting the size of file transfers.
- JavaScript and CSS.
- Volume of resources used and requested by browser.
Each one of these criteria has a huge effect on your PageSpeed score, and even a seemingly minor improvement to one area could impact your grade. Some content marketers will find that some of this is outside their control, as it can come to the hosting solution and third-party resources like Pardot, Hubspot and Marketo.
Your PageSpeed Dictionary
Regardless of which tool you choose, you’re likely going to encounter some unfamiliar terminology as you run PageSpeed tests and try to optimize your site’s load time. This can be a pretty deep rabbit hole, so to help you out, here are some of the key terms to know:
Time to First Byte (TTFB):
This is the time it takes to receive the very first digital piece of information to begin assembling your site before your very eyes. An ideal metric here would be under 200 milliseconds. TTFB is directly affected by both your Domain Name Server (DNS) and your hosting solution – i.e., your server.
For the best TTFB, you’ll likely need to optimize your application code, implement caching or fine-tune your web server configuration. In more extreme cases, you may even need to upgrade your server hardware.
First Paint:
Loading visual content can be one of the more taxing processes related to PageSpeed. First Paint refers to the amount of time it takes to begin rendering anything visible on the page. That can include a number of objects, ranging from the white background of your site to displaying the webpage in its entirety. Since webpages are rendered with a top-down model, items at the top are displayed first. That means, in many cases, your users could already be viewing and reading content while the visual elements load.
Also, definitely keep in mind that First Paint has a strong relationship with Dom Loaded (we’ll get to that in a minute).
Dom Interactive:
This is basically the time between when content has finished downloading and actually parsing your webpage.
Dom Loaded:
Refers to the amount of time needed until there are no stylesheets or JavaScripts preventing the page from rendering. It should be no more than 2 seconds, tops.
One particularly useful measurement is the time elapsed between First Paint and Dom Loaded. That will essentially tell you how much time is needed for all assets to be downloaded and populated on the page and for your users to begin interacting with them.
OnLoad:
OnLoad is the point when everything initially requested by the browser has finished loading and your page is 100-percent complete, assembled and ready to go for the user.
Fully Loaded Time:
This indicates the amount of time needed for all resources to finish loading through any and all means.
PageSpeed in action: How Brafton stacks up
Let’s turn to Brafton’s own site, https://www.brafton.com, to look at how PageSpeed scores can be a bit misleading if you don’t also consider all of the surrounding context.
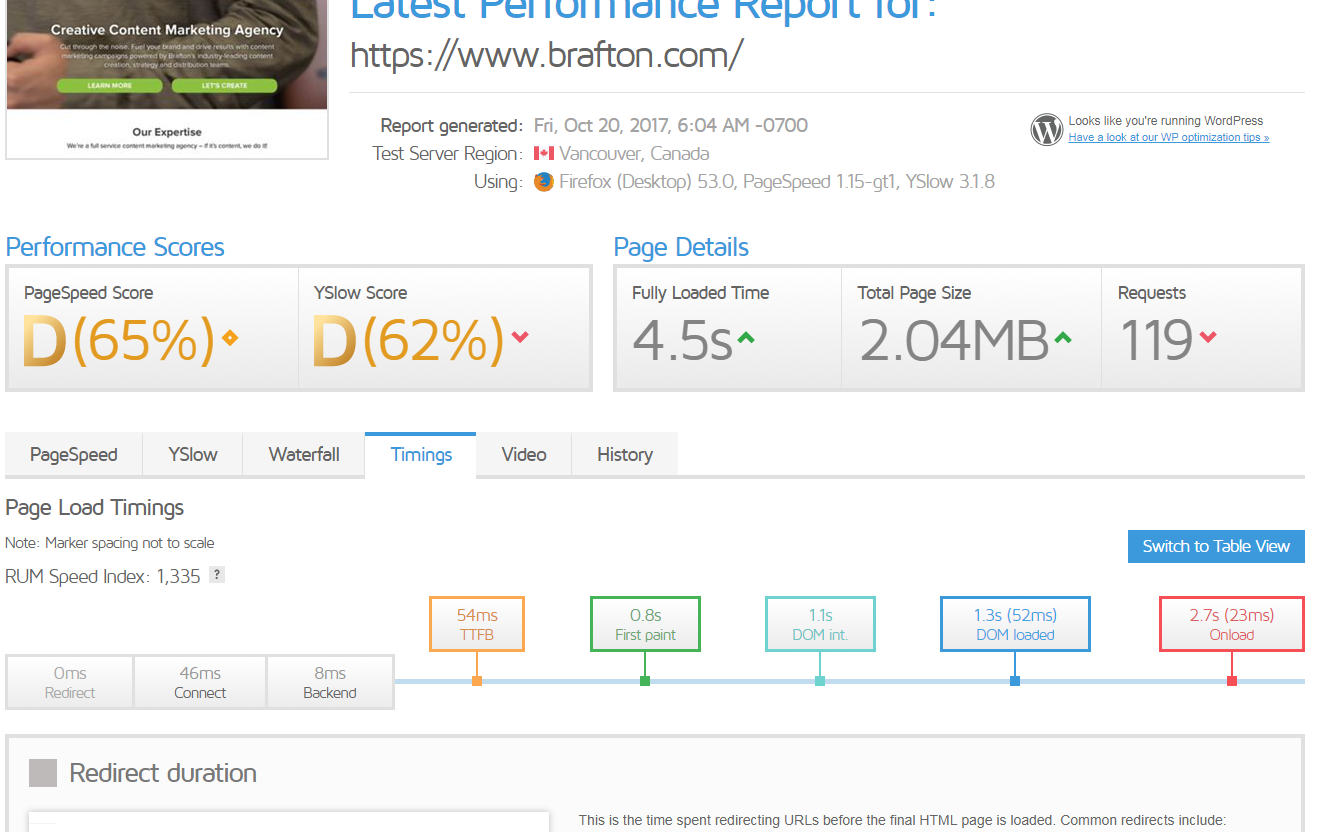
As you can see, our site has a fairly middling score of 65, but that doesn’t tell the whole story. Users are able to begin interacting with the site’s elements in less than 2 seconds, and the entire site is completely loaded within 4.5 seconds. Moreover, it takes less than a second for rendering to become visible.
Users are generally able to see and interact with the page within 0.8 seconds and 1.3 seconds of visiting the site. Not too shabby, especially when you consider we have video loading as a background for the banner.
Shifting gears a little bit, let’s look at the top five issues PageSpeed Insights flagged as affecting our total score:
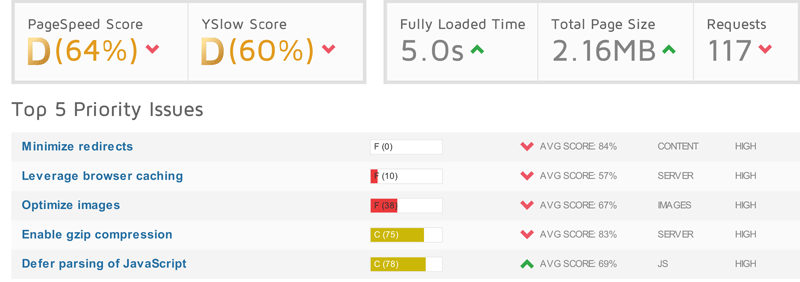
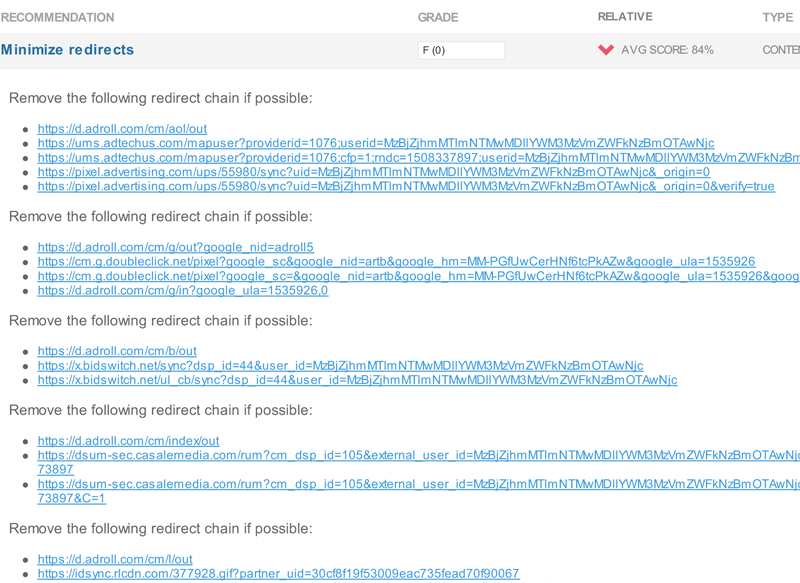
1. Minimize redirects:
Brafton gets a big fat zero for redirects due solely to our use of third-party marketing tools. Unfortunately, our use of AdRoll is causing an obscene number of redirects that we have no control over. Furthermore, these files don’t begin loading until after the Dom OnLoad event, meaning the user is likely already seeing and interacting with our site.
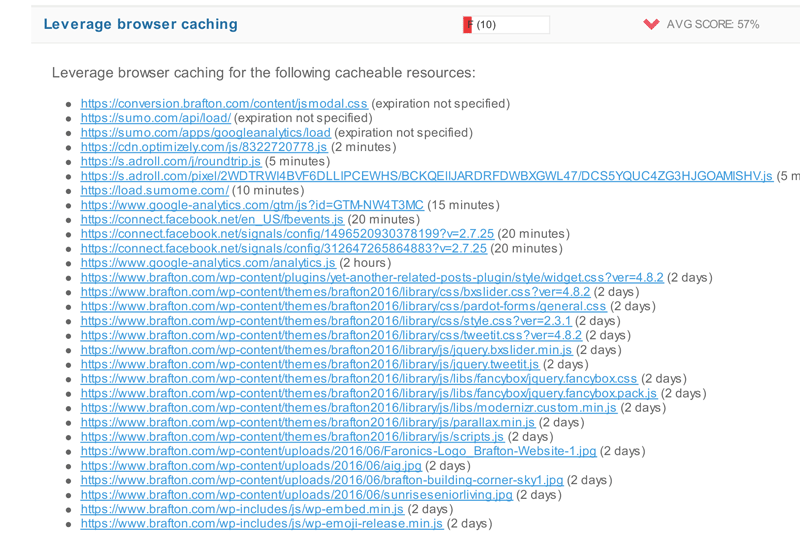
2. Leverage Browser Caching:
We scored a lowly 10 out of 100. Regardless of whether browsers cache a file for two days, two months or two years, the use of caching is important as it prevents the need to fetch fresh copies of that file. Instead, the browser will use previously downloaded copies, limiting the number and size of downloads when viewing a page.
With the exception of our conversions platform, we set a two-day cache period on all of our resources. This means that a browser, unless disabled by the user, will save and store copies of these files for up to two days before trying to get a fresh copy on a subsequent visit.
So why the low score?
The recommended caching time is between one week and up to a year. Since we’re well below the one-week recommended threshold, our score drops a bit. However, that distinction has no noticeable effect on your PageSpeed. The page is not going to load any faster by increasing the time frame from two days to one week.
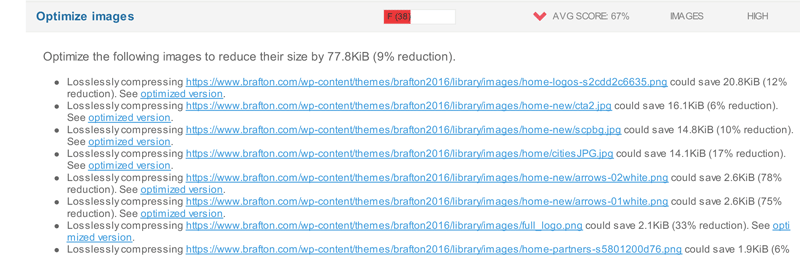
3. Optimize images:
We scored in the high 30s on this one. Better, but still a bad score, to be sure. The tool suggests we save 9 percent of the file size on target images by further compressing our images.
Now, proper image size and compression can have a massive impact on your site’s speed. And installing a plugin to automate this process is the quickest and easiest way to do so. At face value this all seems like pertinent advice.
Here’s the kicker, though: We already have an automated compression plugin on the site. To further compress images for a very low gain just to boost the score wouldn’t be worth the time and effort. We would save less than mere tenths of a second here, and our time can better be spent elsewhere, like writing how to guides.
4. Enable Gzip compression:
We scored a 75 here – not bad but still lower than the average score of 83. What exactly is Gzip compression? Basically, your server can compress the files being sent to the browser, and then your browser can unzip them locally. It’s worth noting that Gzip compression only applies to https.
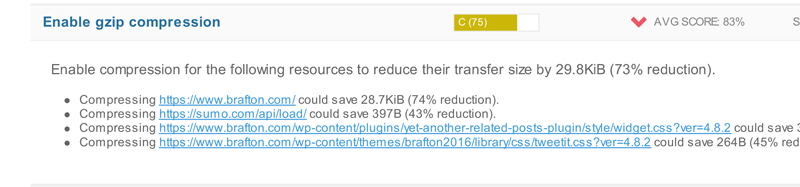
One item here, “https://sumo.com/api/load,” is beyond our control as it’s a third-party resource, but we could focus on the other three that have not been compressed.
Again, there’s a cost-benefit analysis to consider here, since the net savings if we were to take Google’s advice is a measly 29KB. That won’t do much for our site’s load time or its UX.
5. Defer parsing of JavaScript:
For this category, we scored a 78, which is actually better than the average score of 69. These scripts pause the rendering of the page as they run while the top-to-bottom model executes.
We have a couple of options for optimization here: Move the scripts to the bottom of the page or have these resources defer loading until later.
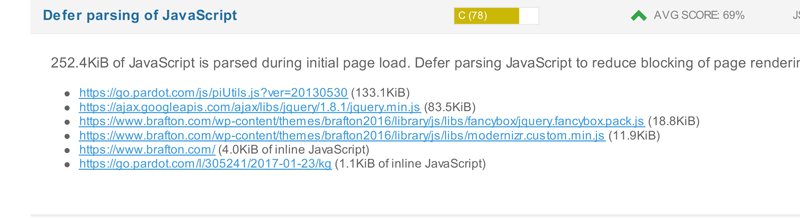 As two of the items are third-party resources with instructions on where they should be placed to get the most return on investment, I think it’s best we take the hit here.
The remaining JavaScript files could potentially be moved to the bottom, but again, the amount of improvement we may see here is minor as these scripts download in 19 ms.
Clearly, these scores don’t always tell the whole story. And it works the other way too: A high PageSpeed score doesn’t necessarily indicate a lightning-fast load time.
For a quick example (I promise not to break down Gzip compression again), let’s take a look at our sister site, https://www.castleford.com.au.
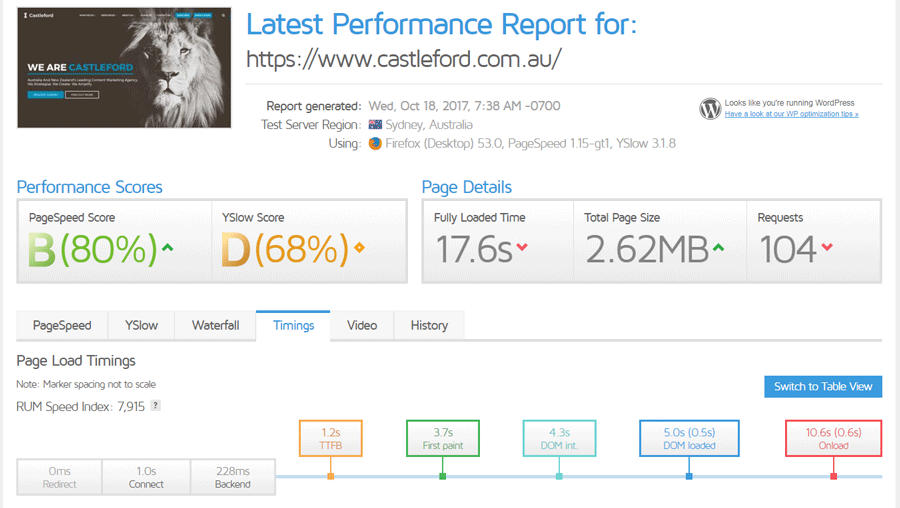
While Castleford has an impressive PageSpeed score of 80 (we’re not jealous at all, by the way), other indicators suggest there’s room for improvement. For instance, when the site loads, users need to wait at least 5 seconds before they can interact with it. Moreover, the site doesn’t completely load for a full 17.6 seconds.
So, next time you find yourself getting hung up on your PageSpeed score, remember that it’s not the end-all and be-all of site performance. It can be a good indicator of loading time, yes, but it doesn’t have final say on how responsive your website is or how your users are able to interact with it.
Look, we’re all under a lot of pressure to make a strong first impression, so it’s understandable that some content marketers are going to obsess over every little detail with their PageSpeed score. Just try to remember that the end goal here is to create a fast, seamless user experience. Tools like Insights can help get you there, but they’re not the destination in and of themselves.
Brafton’s tech and consulting teams eat, sleep and breathe this kind of stuff all day long. We’re obsessed with finding every seemingly trivial change that impacts site usability and performance. So don’t be a stranger. If you want to know how your site stacks up, get in touch with one of our tech gurus and we’ll point you the way forward.