Less than a year ago, infographics were the fastest-rising content type on the web. A format that wasn’t even cited in the CMI’s content benchmark report released at the end of 2011 was used by more than one-third of B2Bs and B2Cs according to data in 2012. And then the market saturated – and many businesses were missing out on bottom-line benefits of infographic marketing to focus on their link building potential.
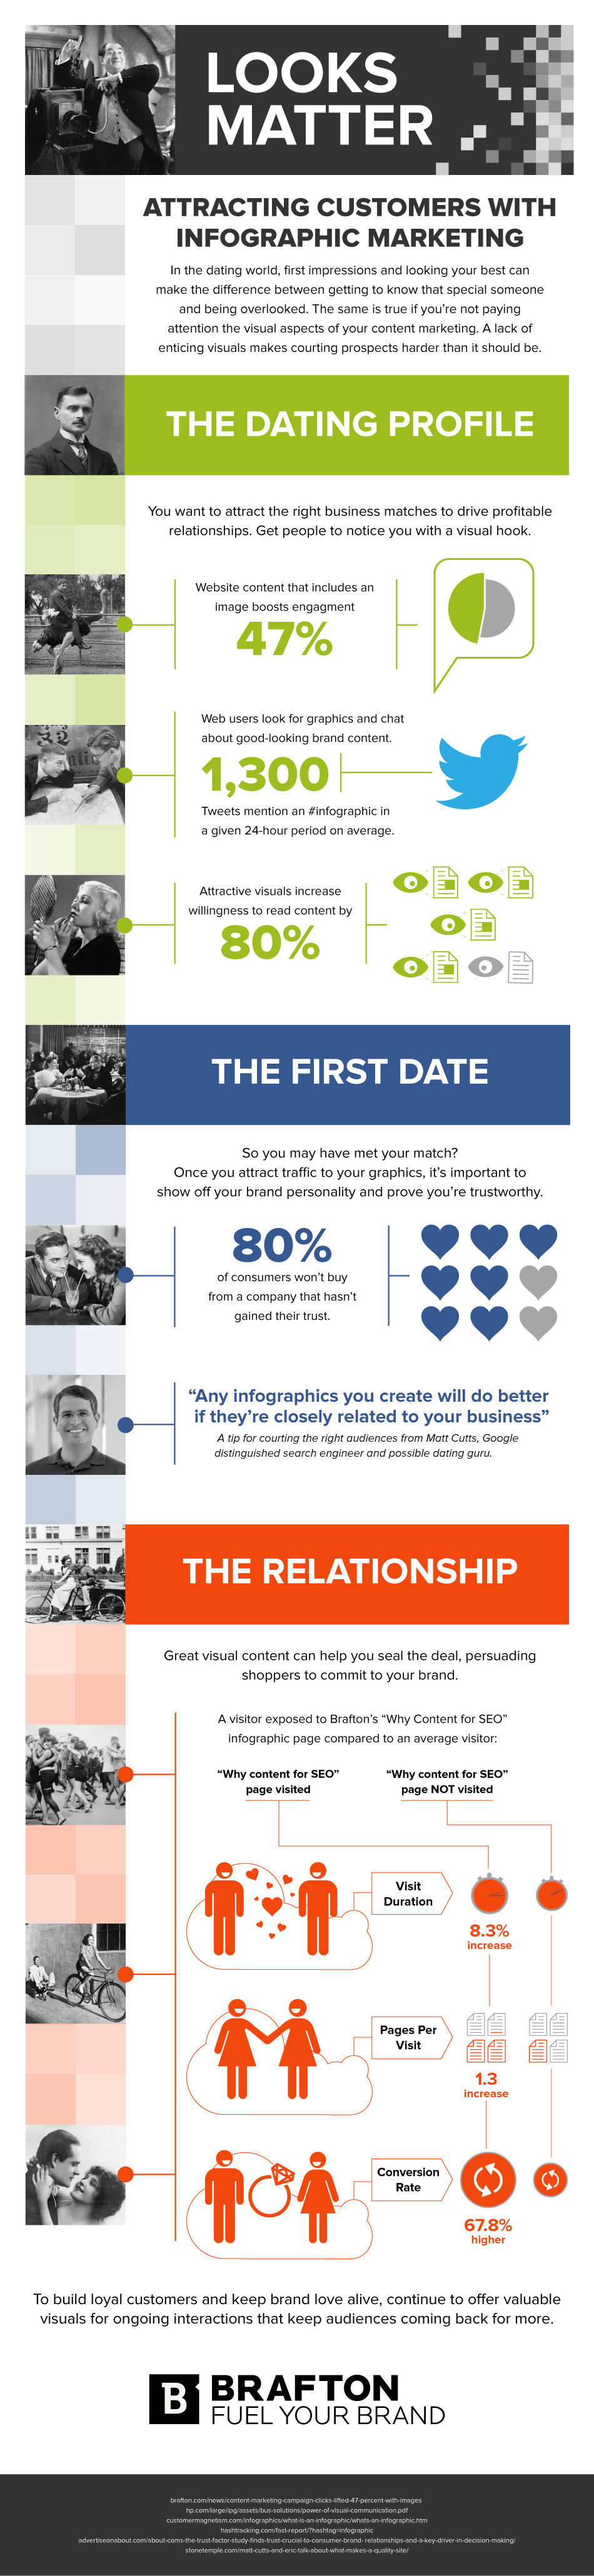
Brafton’s latest infographic, Looks Matter: Attracting Customers with Infographics, explores why graphics are a prime tool for relationship building… though inbound links can follow.
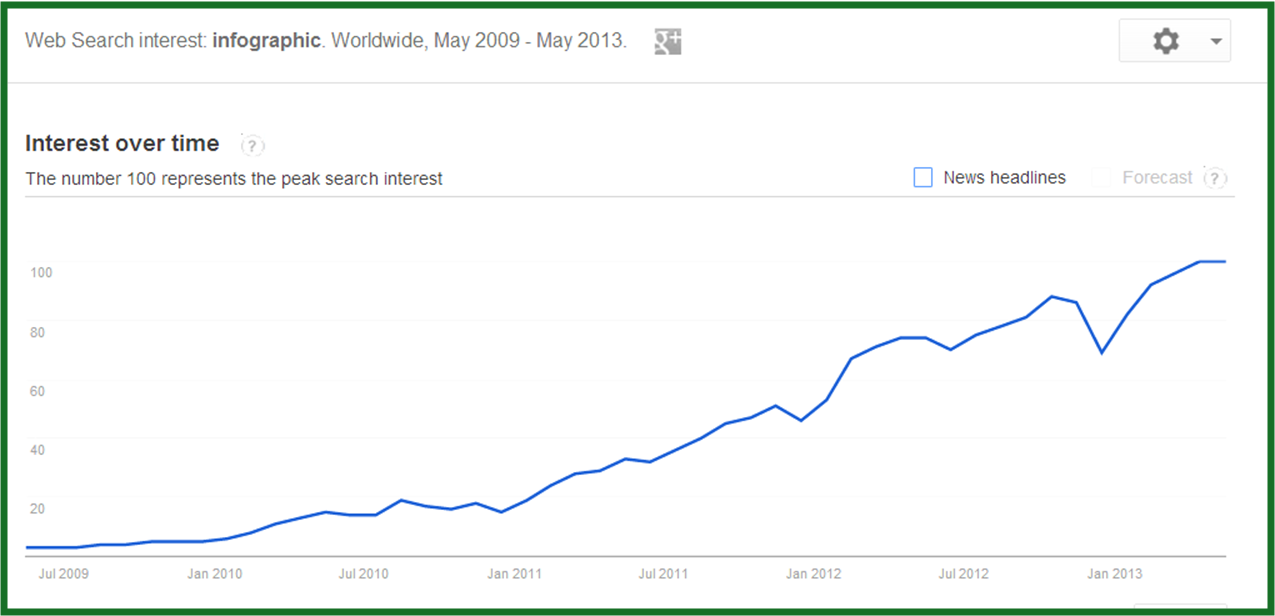
Graphics became a go-to format for link building as businesses were increasingly catching on that content is essential for SEO. This makes sense to the extent that web users did – and still do – love and share them. Search activity for graphics jumped from a three to nearly 100 (which signifies peak searcher interest) in Google’s Search Trends between May 2009 and May 2013.
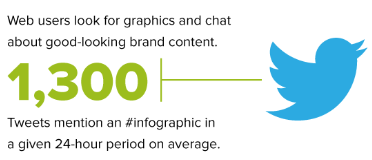
More, Hashtracking data from earlier this year suggested more than 1,000 Tweets a day used the hashtag #infographic.
But there was evidence to suggest marketers weren’t taking people’s enthusiasm for infographics as an opening to start interesting brand conversations – at least in Google’s mind. As Matt Cutts told Stone Temple Consulting:
“What concerns me is the types of things that people are doing with [infographics]. They get far off topic, or the fact checking is really poor .. I would not be surprised if at some point in the future we [started] to discount these infographic-type links to a degree. The link is often embedded in the infographic in a way that people don’t realize, versus a true endorsement of your site.”
There is an SEO benefit for infographics when they’re done right, and link building aside, there’s another huge benefit: Relationship building. If you haven’t heard, relationships are the new link building any way – boosting both visibility and positive sentiment among the people you’re trying to reach.
With infographics, brands have the chance to work in a visual medium that can have real emotional impact, which is the subject of Brafton’s latest infographic – Looks Matter: Attracting Customers with Infographics. And if you start your infographic marketing with a premise that brand audiences care about, organic link building can follow.
Visual content: Opening the door for audience relationships
Infographics can get your foot in the door with new users and help build loyalty among existing audiences. There are plenty of stats supporting the idea that graphics resonate with people. Here are a few (in visual form):
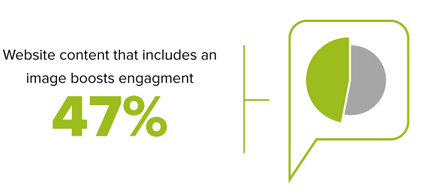
Wesbite content that includes an image gets a 47 percent higher click-through rate than articles without images.
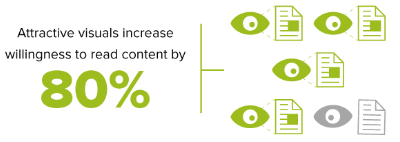 Attractive visuals increase people’s willingness to read by 80 percent.
But catching clicks or getting people to read a piece of content is only as good as the the information offered – meaningful emotional impact hinges on your ability to marry great designs with information related to your industry, or your customers’ needs and interests.
Infographic subjects: Striking a (brand) chord
In some cases, graphics about a specific service or the line of products in a Spring 2014 collection will be useful and lend themselves to good-looking graphics. In other cases, it might be tempting to create a graphic on a popular trend that makes no sense for your brand niche. It’s critical to find subjects that give people industry information they want, without getting too commercial. This comes back to the ever-present content marketing principle of good storytelling and understanding your audience.
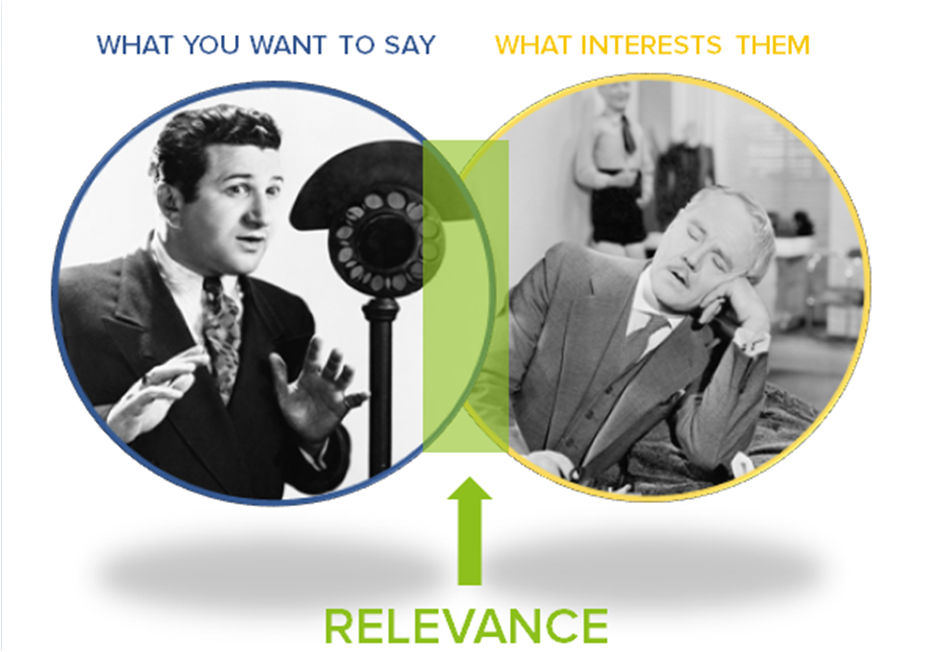
Find the sweet spot that covers what your audience wants to know and what you want to say.
- Careful social listening
- Industry monitoring
- Customer surveys
- Web marketing interaction analysis
For example, with Brafton’s first infographic, Why Content for SEO, months of following news developments in the industry pointed toward a need for insights on the relationship between content and search rankings. More, a customer survey and a look at Brafton’s web analytics revealed this content marketing brand engages a large group of highly SEO-focused leads. The topic was natural.
Executing the first one was slightly less natural as it took strategist, designer and writer out of their comfort zones… which brings us to visual impact.
Visual impact: Marrying message and design
A good infographic is a work of content marketing collaboration. Marketing strategists and researchers may want to cover certain ideas or stats, and the designer will be responsible for telling them when they’ve reached a limit for what can be put in a single image. On the other hand, designers might have good ideas for visual themes, and it will be the marketers and researchers’ roles to ensure there are no inaccuracies or fluff.
Finding appropriate topics with visual potential is essential to having a desired impact. Brafton recently hosted an infographic marketing webinar, which included insights on finding subjects that can translate into designs with the right emotional (and ultimately, marketing) impact. The full webinar – which also covers tips for promoting graphics – is available online. In the mean time, here are a couple of strategies for framing market and editorial research into topics that make compelling visuals:
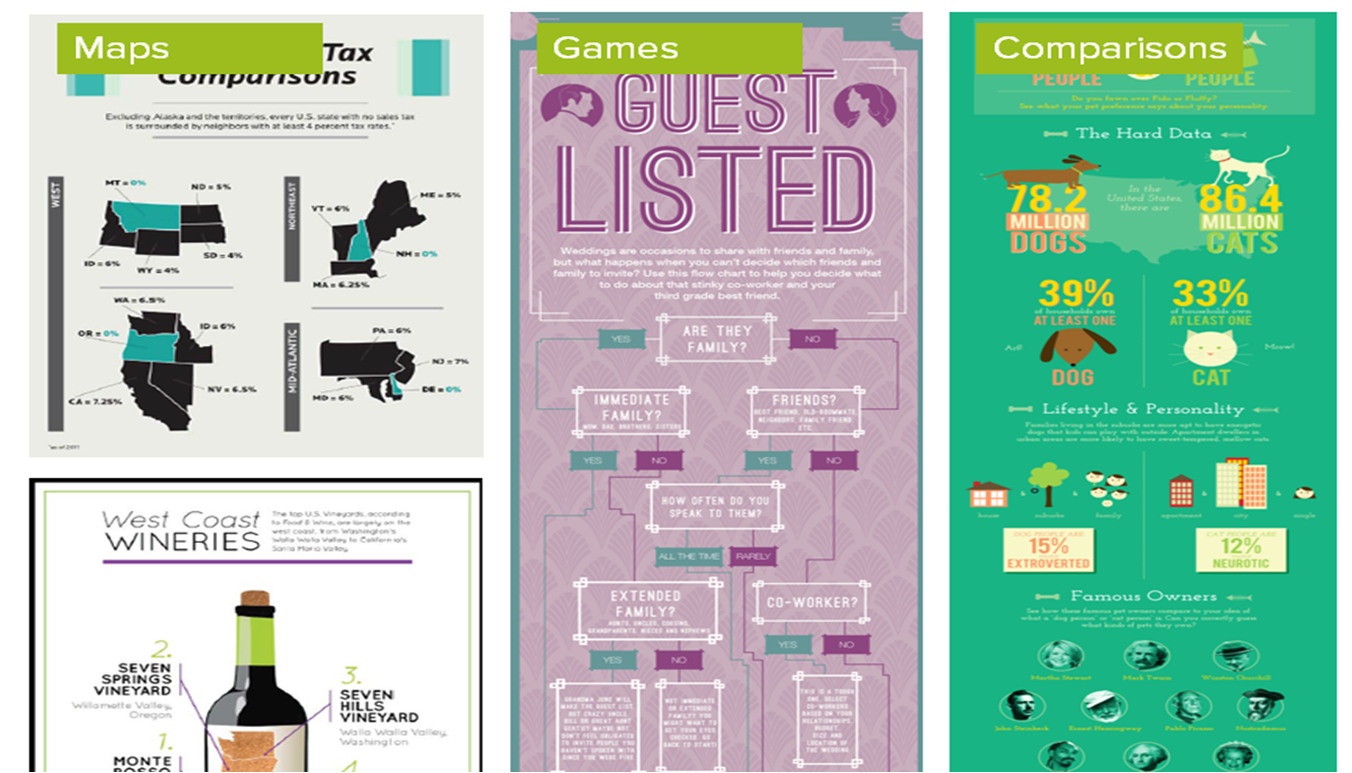
- Think local. Maps of where products or service-related issues are thriving can be useful and good-looking.
- Make something complicated a game. With a “choose your own adventure” flow chart or ripple-effect graphic, explain how something works or demonstrate its impact.
- Compare things. Present data related to two or more specific products, services or audience segments in an easy-to-compare chart
The key is to bring together information and presentation to create something related to a brand – and its audience. This is key to audience building, and another Matt Cutts’ quote on infographics hints at its potential for real link building success:
“Any infographics you create will do better if they’re closely related to your business.”
Measuring relationship building: Infographic success … beyond links
When businesses successfully execute on-brand graphics, there’s potential for meaningful audience engagement and bottom-line business results that remind marketers links are a means to an end.
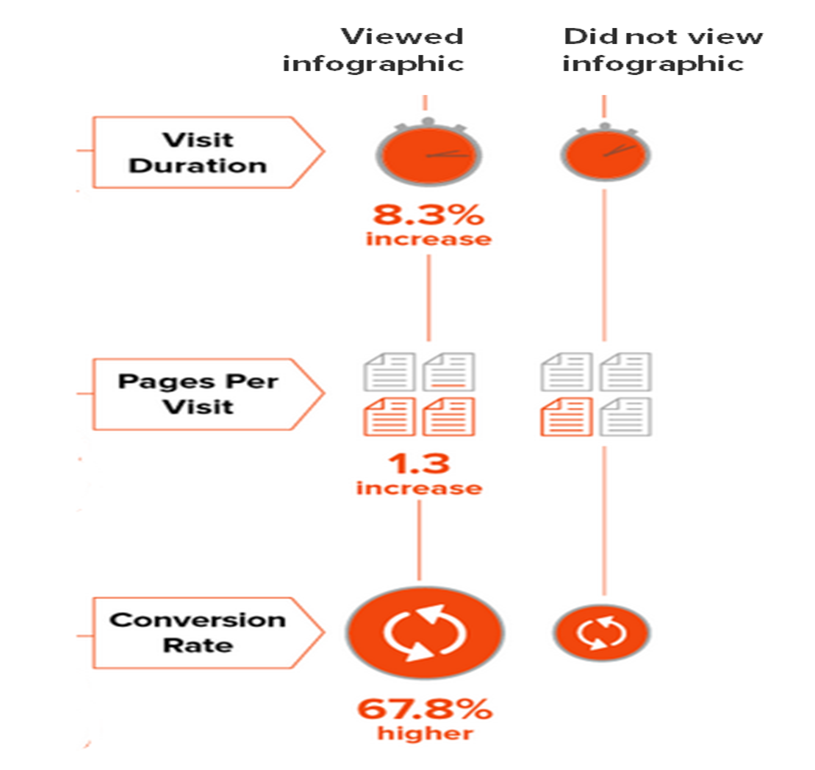
During its first month of publication, Google Analytics show Brafton’s Why Content For SEO viewers who visited the site connected connected with the brand more than traffic that was not exposed to the graphic. Check out the chart to the right.
Traffic exposed to the infographic demonstrated an 8.3 percent increase in visit duration, viewed 1.3x pages and had a 67 percent higher conversion rate (with conversions being defined as anything from resource downloads that facilitate lead collection to scheduling demos.
How are you using infographics for relationship building – online or off?