

Welcome to our latest installment of Web Analytics Monday, or #WAM as we so lovingly call it over in these parts. Today we’re looking at how to find the best time to post content to your site.
Oh boy, there is a lot of data out there on this one. And some offer common sense guidelines such as, “Post in the mornings between Tuesday and Thursday.” (Turns out a sizable chunk of the online population isn’t working all that hard on Mondays and Fridays, uh thank you.)
And another one.
But these are indeed very general guidelines. The problem is that your audience is as unique as a snowflake and may behave in ways that don’t fit into any published best practices. When uncertainty is at foot, we need to consult the data. Today we will be diving into visitor timing by building custom reports. Let’s dive in.

Where you at?
None of the data we pull is going to make any sense unless we know what time zone Google Analytics is reporting. Find out where GA thinks you are located by going to Admin → View Settings.
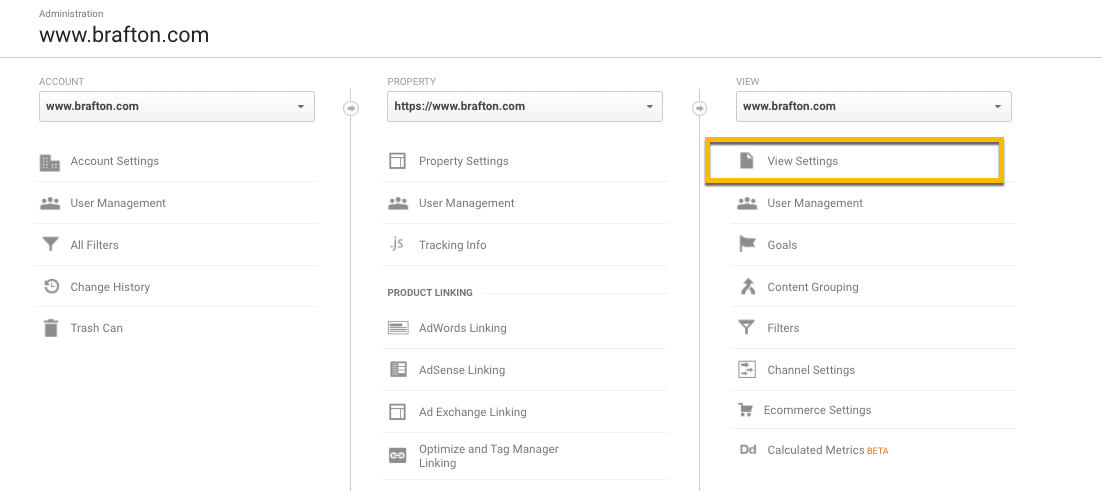
Our account is reporting in United States Eastern Time, we will need this in our back pocket later.
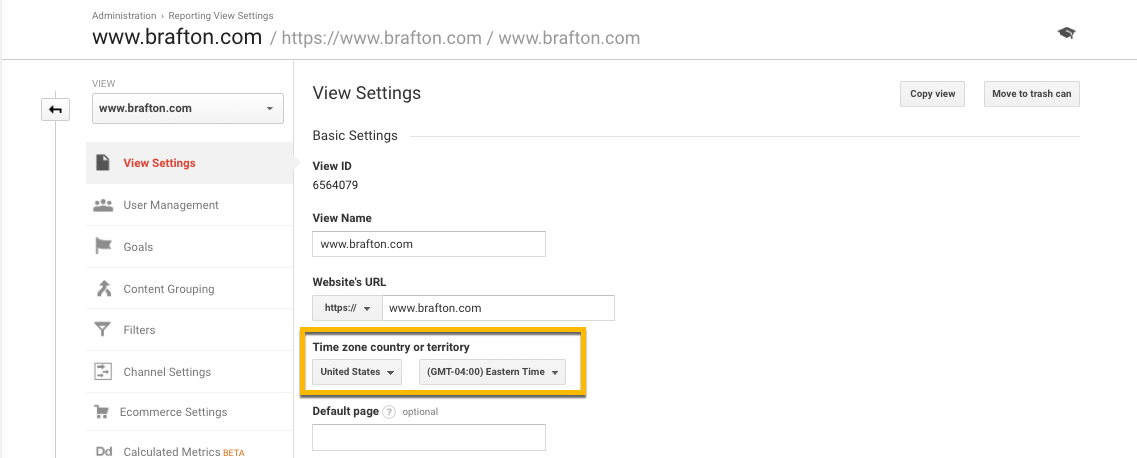
This is important because Google Analytics is going to report session numbers based on a 24-hour clock in this time zone.
Finding our favorite days of the week
Now we need to create a custom report on session and engagement data sorted by day of the week. Click on Customization → Custom Reports → New Custom Report.
Note: You can import lots of great custom reports that have already been created with a couple clicks of the mouse in this section.
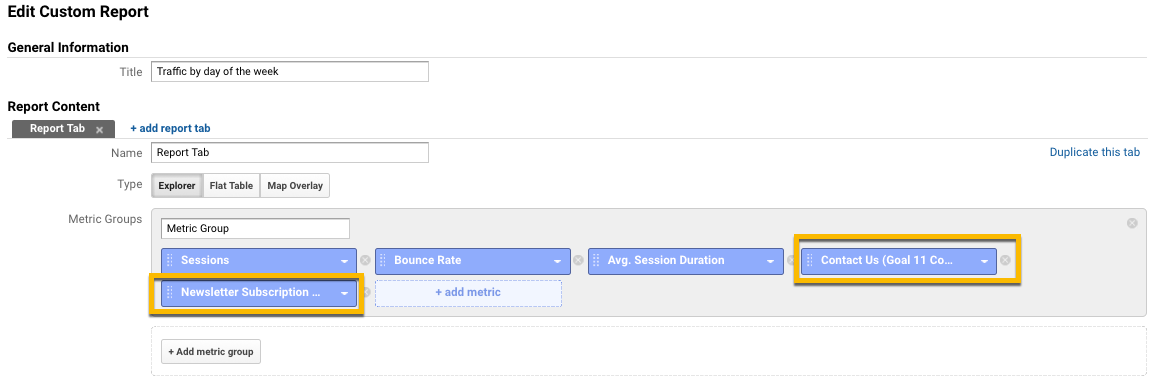
For the sake of this exercise, we are going to build this report from scratch. You should see a screen that looks like this:
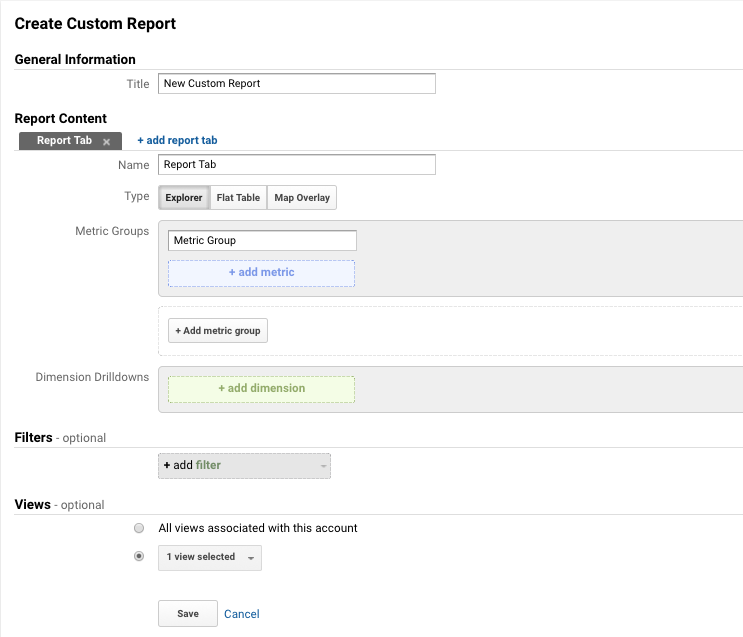
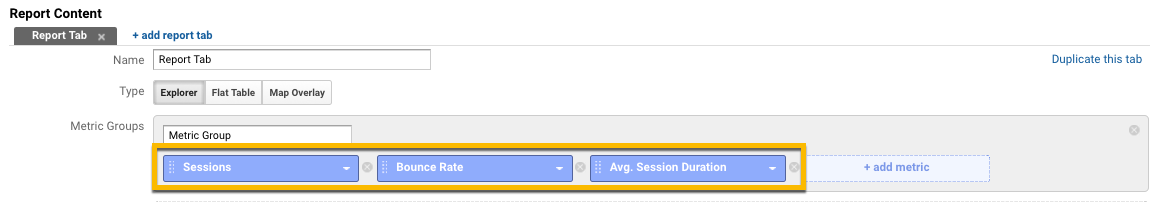
We are going to name this report, “Traffic by day of the week.” Below, we need to add the metrics we want to evaluate to determine performance by day of the week. I recommend starting with the basics, then adding more complexity as we go along. Select:
- Sessions.
- Average session duration.
- Bounce rate.
The “Dimensions Drilldown” section below is going to determine how our metrics are going to be grouped. Select “Day of Week Name.”

Choose the View you want to save this report in, then click “Save.” You should see a screen that looks similar to this.
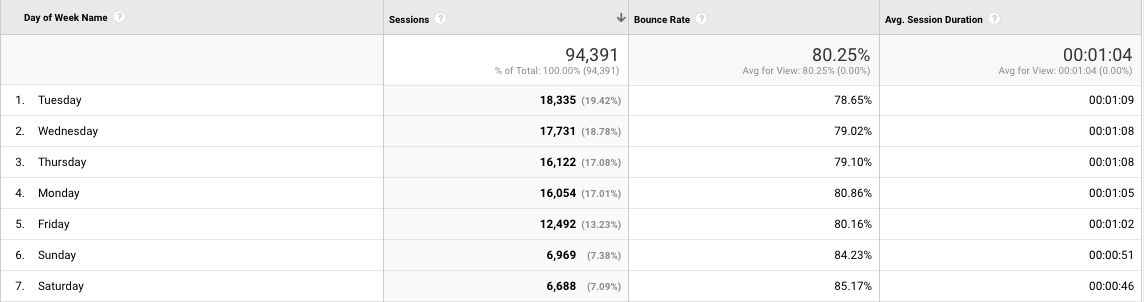
Harrumph, we have data!

This data shows the bulk of our traffic comes on Tuesdays and Wednesdays. Mondays and Thursdays show slightly less traffic, and Friday through Saturday drop off a cliff. We can safely assume that the majority of our visitors consume our content in the middle of the week.
The takeaway: Our most important content needs to be published between Tuesday and Thursday.
It would be interesting to find out when our conversions are happening throughout the week. Click “Edit” on the top right hand side of the screen so we can add in more metrics to this report.
I am going to select one macro conversion and one micro conversion to evaluate.
Click “Save” to see your report. Sort by macro conversions to see which days of the week are generating the most commercial value.
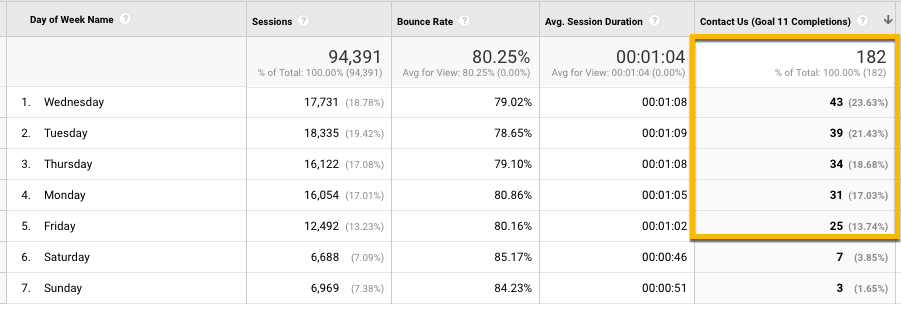
Tuesday and Wednesday make up 45% of all macro conversions! We now know that the majority of our site visitors consume our content on Tuesdays and Wednesdays, AND they are the most likely to contribute commercial value. Our case is very strong for our assumption that we should publish our most valuable content on these days. And we can also conclude that we do not want to publish anything important on Fridays or weekends.
We also want to know when people are most likely to subscribe to our newsletter. We will sort our list by newsletter subscriptions.
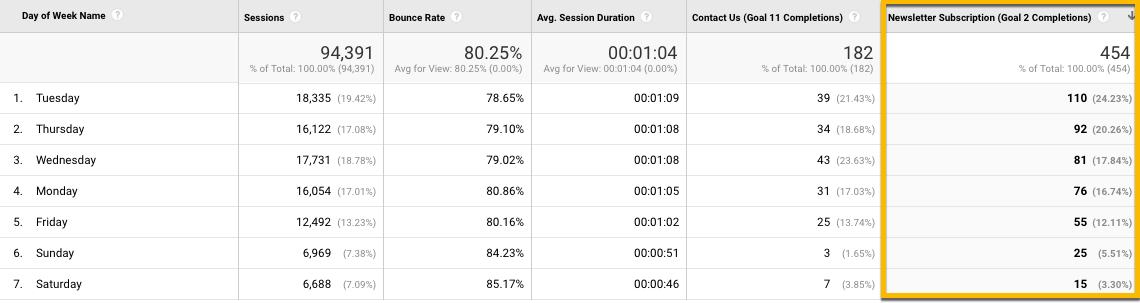
There is Tuesday again, positioning itself as our most important day of the week across the board from both a macro and micro perspective. Awesome, but what time of the day should we be posting our content?
Finding the best time of day to publish content
Click “Edit” on the top right hand side of the screen. We are going to keep all of the same metrics and swap out our Dimension Drilldown to “Hour.” Note that there are other options including “Hour Index” and “Hour of Day” – don’t select these.
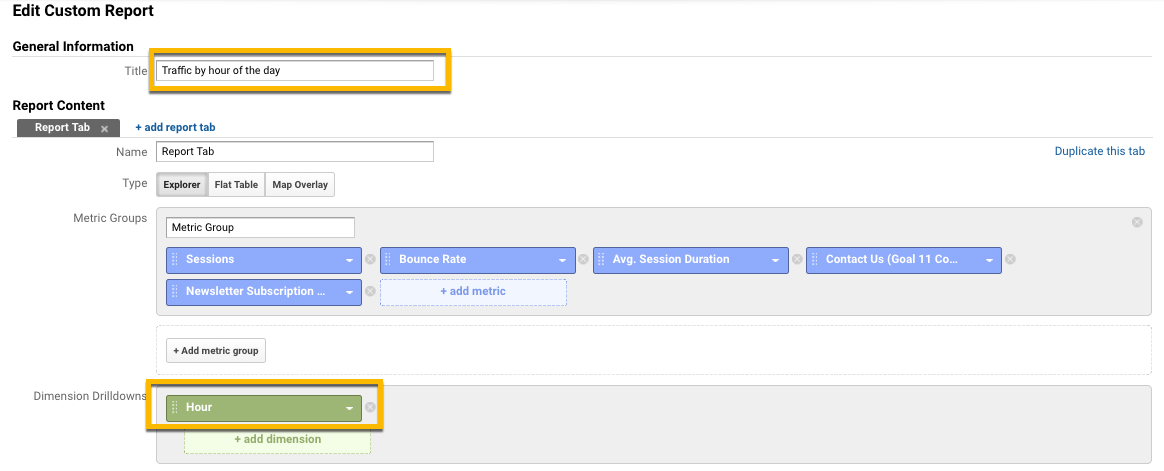
Rename your report and click Save. The resulting report will lend itself well to data visualization, so we are going to start our analysis with the graph it produces.
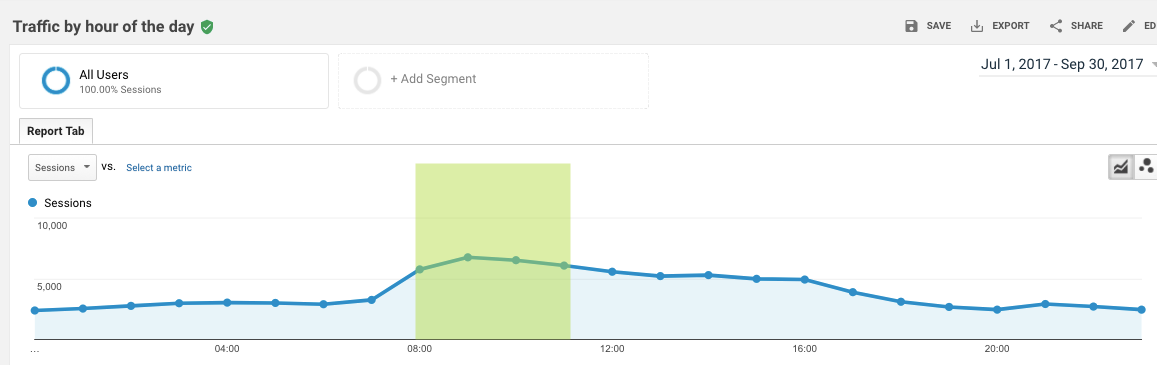
Note the very pronounced spike at 8 a.m. ET, coming to daylong peak at 9 a.m.. Traffic slowly decreases throughout the day, then noticeably drops at 5 p.m. ET. Let’s take a look at the numbers below to confirm our visual inspection.
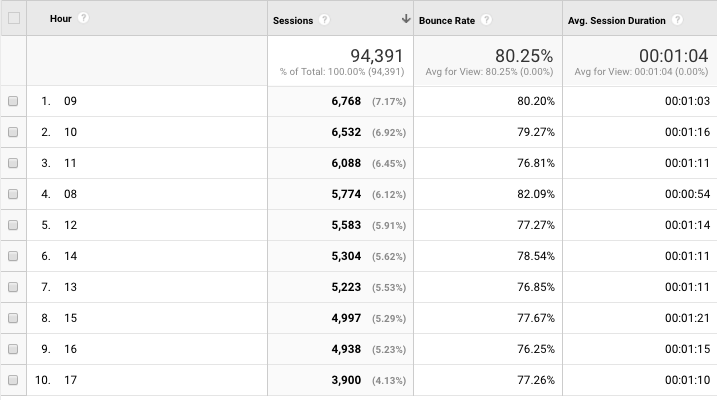
Nine and 10 a.m. ET are indeed our peak hours for traffic. It seems that the ideal time to post our best content is on Tuesdays 9 a.m. ET. Let’s dive in a little deeper to look at what time of day macro conversions are happening.
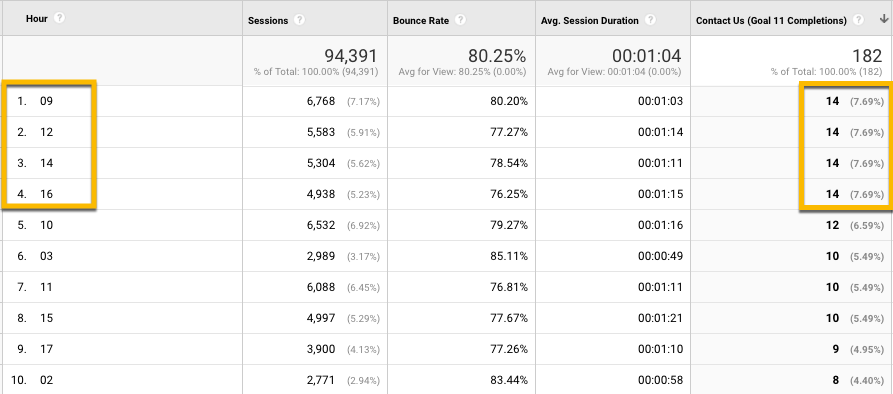
There doesn’t appear to be a clear pattern emerging here; conversions happen throughout the workday (Eastern Time). Finally, we’ll see if any patterns emerge from newsletter subscription timing.
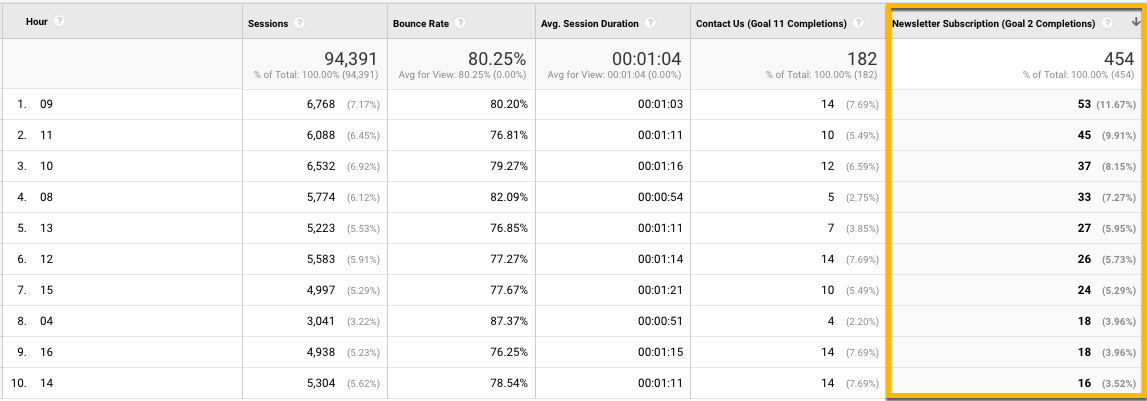
Thirty-seven percent of all newsletter subscriptions happen between 8 a.m. and 11 a.m. ET. Without a doubt, the East Coast morning is our sweet spot.
Tuesday morning rocks!
Our analysis proved the majority of our visitors consume our content on Tuesdays at 9 a.m. ET. Further, the majority of our newsletter subscriptions occur at this time as well. So what do we do with this information? Should we only publish on Tuesdays?
Definitely not.
We will continue to publish content every day of the week. However, it would be highly advisable to publish our strongest pieces (case studies, eBooks, success stories, deep dives, etc.), on Tuesdays and Wednesdays around 9 a.m. Eastern Time. This will ensure we meet our audience with the content they want to consume when they want to consume it.
This is all about tailoring our strategy to our audience’s interests and natural behavior. This is a good first step.
Check in next week for another edition of #WAM!