

We try to keep our metrics as secular as possible, but in this case, we must bend a knee.
No other metric gives you a health check, segmented landing page performance metrics and SEO insights all wrapped up within the same report. It’s like a Walmart where everyone is happy, and you sip wine while someone else does the shopping for you.
So show me the goods, dude
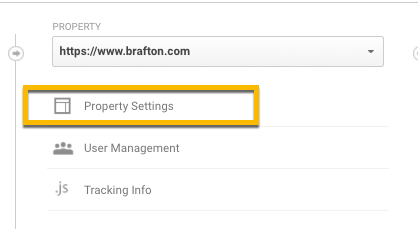
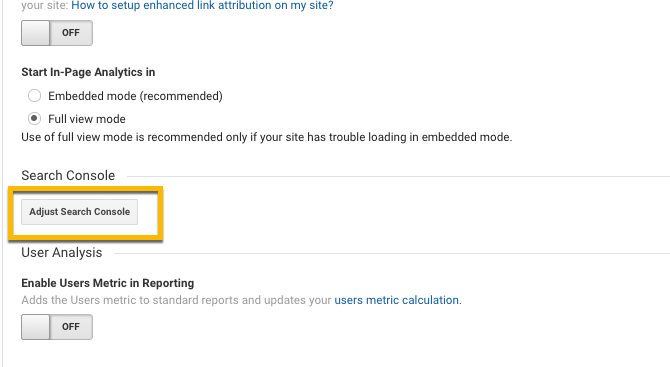
Hold your horses, you have to make sure your Search Console is synced with Google Analytics, first. Go to your Admin panel, click “Property Settings” then “Adjust Search Console.”
Select your Search Console account, and BAM, you’re all set. Now you have access to search visibility reports. This includes:
- Landing page impressions.
- Queries.
- Average Google ranking by page and query.
- Click-through rates.
Each of these metrics has an important story to tell, which we will get into in more detail. But first, let’s find the data. Go to Acquisition → Search Console → Landing Pages. If you properly synced your accounts, you will see an awesome graph like this:
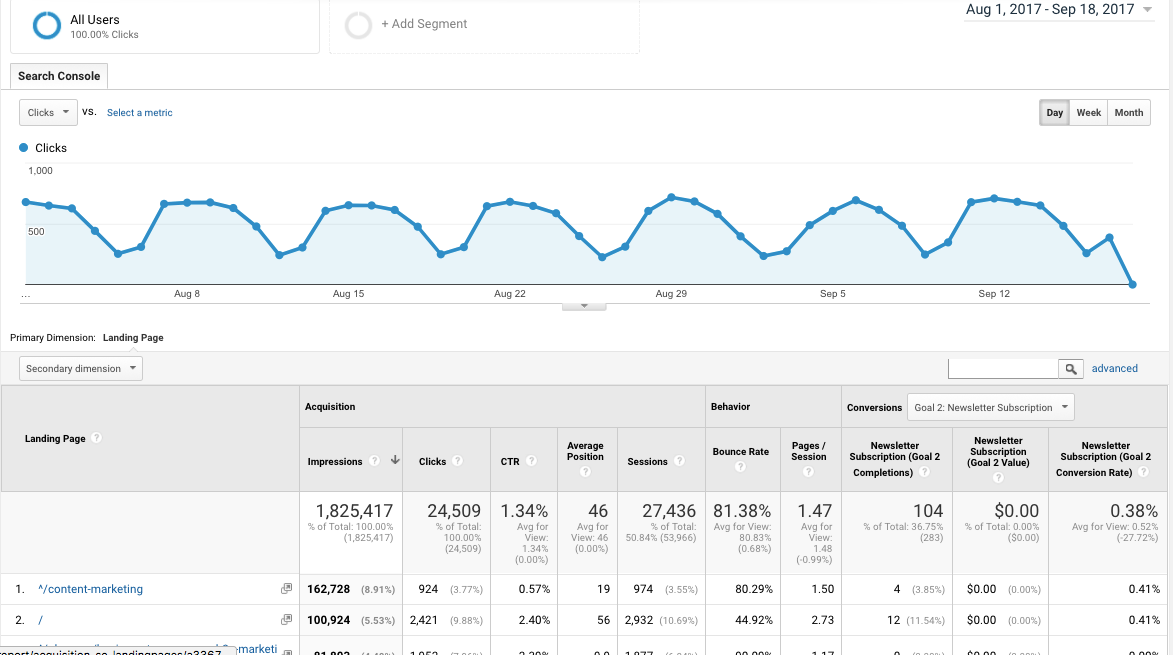
If you don’t see any impressions populating, you didn’t sync to the right Search Console, or your Search Console is broken. If you’re seeing impressions, you’re in business. So let’s take care of some terminology so we know what it is we are looking at.
- Impressions: The number of times your URL showed up in a search result.
- Clicks: The number of times visitors clicked on your URL from a search result.
- CTR: Click-through rate; the number of times your URL is clicked
As mentioned, each of these metrics tells a story.
Impressions
Any time your URL shows up in a search result, it is counted as an impression. For example, if I search, “weird origami shapes,” the first page of results looks like this:
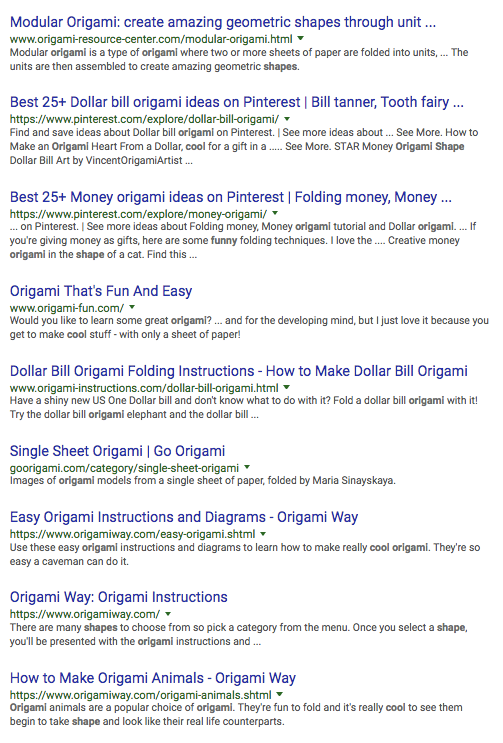 Each of these nine results will have received one impression. If I click to the next page of results, each of those results will receive one impression. Let’s jump back into Google Analytics and sort by impressions. I want to see what page is most often showing up in search results.
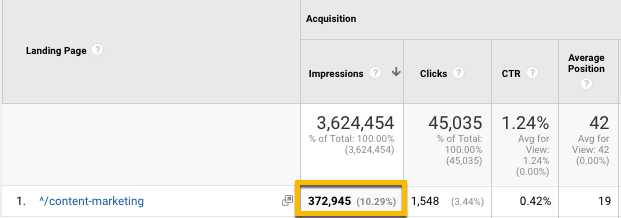 Over the past three months, this page has shown up in search results 372,945 times. Wow, that’s quite a bit! And if you look closely in that box, you will see that this page generates 10.3% of our entire site’s impressions. This tells us a couple things:
- The page is properly indexed by Google and showing up in search results. This would register zero search impressions if the page wasn’t being indexed properly.
- The keywords this page ranks for are searched very often.
- The page ranks well for those keywords because most people don’t go far beyond the first page of results.
It’s very important to note that this metric indicates site health as much as it measures search performance. If the page wasn’t generating impressions, there would likely be an issue with indexing. If Google isn’t finding your page, you have a major problem.
If we want to know what keywords people are using to find this page in search results, we click on the landing page in Google Analytics.
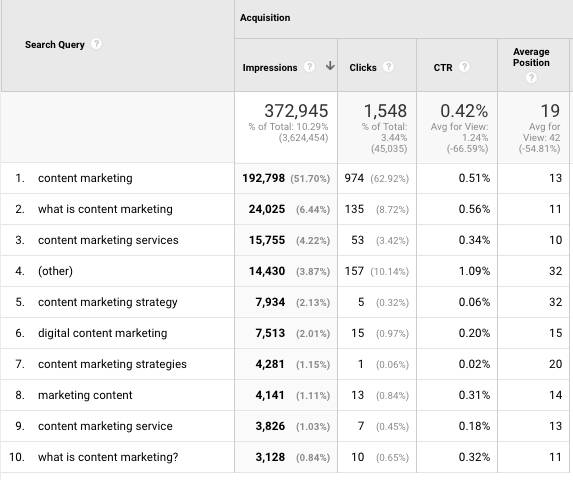 Note that 51.7% of the time this URL shows up in search, it’s for the keyword “Content Marketing.” This is great information to know because it gives you insight into what people are expecting to learn when they open your page.
Now if we want to know how a particular section of a site is doing, we will add a filter. Go to the top of the page and enter the section of the site you want to evaluate. I want to see what the blog is doing, so I will enter that into the filter.
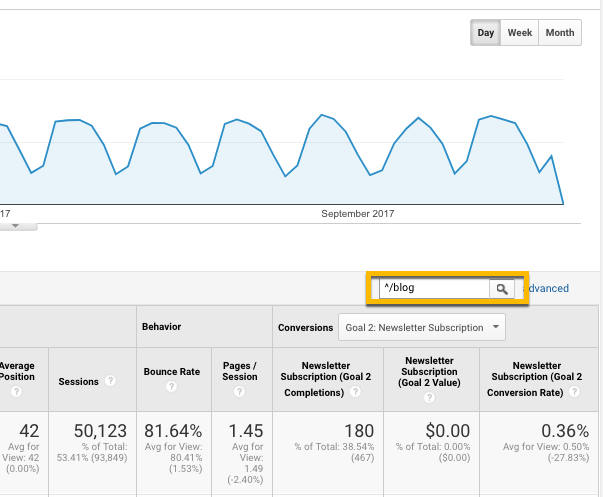
You will see a new view with just the section of the site you’re interested in.
A couple interesting insights emerge from this filter:
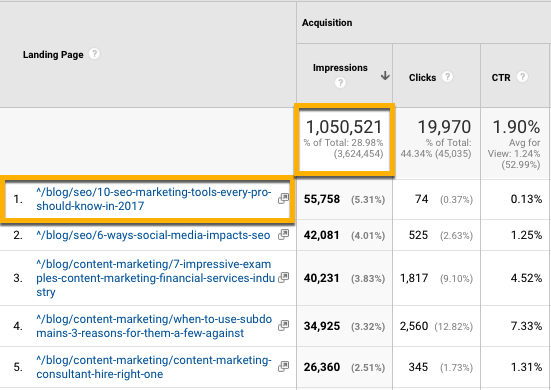
- The blog is responsible for 29% of all site impressions.
- The top article that shows up in search results is “10 SEO Marketing Tools Every Prospect Should Know in 2017,” which showed up almost 56,000 times in search results over the past three months.
With this information, we know our blog plays an enormous role in our search presence. But how often are people actually clicking on our results?
Clicks
There are a number of factors that influence whether your link receives a click. Some of them are:
- Where you rank (Position). Ranking on page 2 or deeper is a death sentence, and you will likely get a low number of clicks.
- Title tag. What is the title of your page? Is it interesting? Does it accurately describe what the searcher will find on the page?
- Meta description. Do you have a custom-written meta description, or is Google pulling in random letters and characters? Your meta description should be excellent marketing copy to encourage click-through.
These factors dramatically affect performance. But fortunately, they provide insights into how to improve your content! Let’s take our top-impression article as an example.
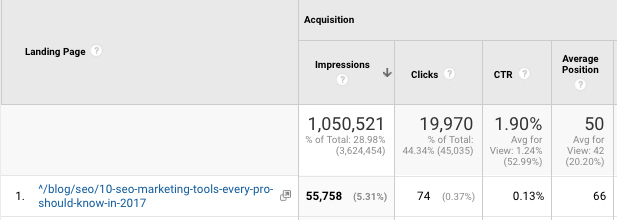 Note that this article has shown up in search results almost 56,000 times but only received 74 clicks. This should set off a few red flags. One or more of the factors above may be at play here. Let’s run through our diagnostic checklist.
- Position: On average, this article shows up on the seventh page of Google results. When was the last time you clicked on a result on the seventh page of results?
- Title tag and meta description: Let’s take a look at how this article shows up in search results. We want to see if there is anything that would prevent a searcher from wanting to click on the link.
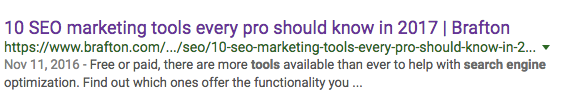 No red flags here, this looks pretty good.
So here is what we know: This particular topic is searched very often, as indicated by the number of times the article showed up in search results. It’s a popular topic, to say the least. We also know that we are ranking very poorly in Google and, as a result, no one is clicking on our link.
We need to revisit this page and optimize the content to move up in rankings. Google doesn’t currently believe that the content we are providing on this page is as thorough or in-depth as our competitors’ pages.
Let’s take a look at the keywords that are generating the most impressions.
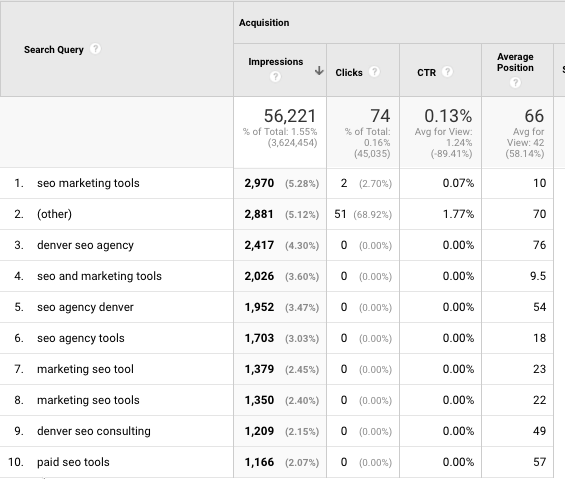 The majority of these phrases are centered around “SEO marketing tools.” This is the keyword we need to optimize for. I’m going to go back into this blog article and see how well we are covering the topic; perhaps we can go more in-depth with our content. I’m also going to look at our competitor pages and see what they are writing about; they may have written more comprehensive pieces than we have.
The takeaway here is that we have found a hot topic, but what we have written isn’t good enough for Google to put in the top results. There is work to be done.
CTR
Click-through rate is the number of clicks a URL received divided by its number of impressions. This tells us the percentage of the time an article is clicked on when it shows up in search results.
A good rule of thumb is that if an article has a low CTR, it is either ranking poorly or has a bad title tag or meta description. A high CTR usually corresponds with a high average ranking and a strong title tag and meta description.
Going back to our example, our article has a CTR of 0.13%. So for every 1,300 times our article shows up in search, it gets one click.
This is terrible, and it re-emphasizes our need to optimize this page for better search rankings.
Are you ready to worship, yet?
With one metric, we learned how to measure site health, gained insights into SEO performance, gauged topic interest, learned about rankings and found a high-value article that we need to optimize. If you can find a more comprehensive report available on the market, I will buy you a bottle of your favorite beer. I dare you, email me at jeff.baker@brafton.com.
And I never welch on a bet.
We’ll see you next week for another edition of #WAM.