
When Brafton’s infographic marketing services debuted in 2011, we were all about the data. Rich, consuming, engaging, set for success.
It’s been a few years now, and despite countless client success stories, we knew it was time for a review.
It took a team to assess the product that’s been deployed for more than 750 customer brands – led by CEO Richard Pattinson, Senior Director of Product Meredith Farely and Vice President of Content Francis Ma.
Here’s a look at what we learned, the ways we’re updating our graphics to benefit clients and how we believe brands should approach their graphics:
Infographic success: Do you need more or less data?
The data’s in: Succinct stories with fewer data points make more successful graphics. Infographics need enough facts and figures to make a compelling argument, but the numbers can’t be plugged in at the cost of a clear and visual narrative.
 Your design take home: Select only the most impactful stats to tell your graphical story.
We also surveyed several of Brafton’s own infographics in this process to discover which ones had the most success building traffic; delivering engagement, measured by time on site, bounce rate and social shares; and converting viewers.
We found:
- Our top five performing infographics averaged 11 data points each.
- Our infographic packed with the most data points (26) actually had the fewest conversions.
In retrospect, it makes sense. Here’s why:
 Readability
Readers seek out infographics because they offer a visual representation of sometimes hard-to-explain concepts. To make things simple, graphics must be bite-sized and digestible. When you’re taking in an infographic, you typically don’t have time (or frankly, don’t want) to read a long-form blog post.
“Brafton’s design product updates take a holistic approach that ensures form and function are symbiotic.”
Queue 20+ statistics and a reader, understandably, can be overwhelmed.
“We reviewed hundreds of infographics, and we wanted to like the more data heavy graphics because they offer indisputable substance. Still, the graphics with fewer data points were typically better from an editorial perspective,” Senior Director of Product Meredith Farley said. “Brafton’s design product updates take a holistic approach that ensures form and function are symbiotic.”
Engagement
Graphics Production Assistant Jesse Mack summed up his argument in a simple question: “A wholly statistical graphic can be authoritative, but is it conversational? It may be extremely helpful, but does it make people laugh? Make a great graphic first and foremost – then worry about the data points.”
“Humor, authority and insightful statistics are things some really good infographics contain, but none of them is essential to success.”
For more insights from Jesse, check out “Stop Chasing Stats: A look at infographic value propositions”
UX
While there are definite perks of infinite scroll (Matt Storms covered some at SMX West), load time, navigation issues and SEO potential all argue for comparatively more defined scrolls. Don’t exhaust your viewers with endless graphics.
As our Design Director Ken Boostrom pointed out, a shorter, more comprehensive graphic will look better to mobile audiences (who account for 60 percent of all internet access.)
“We’ve all seen an infographic that’s so long, it feels like an infinite scroll,” Ken said. “On mobile, where print is smaller to begin with, a long graphic can seem disjointed; a user won’t be able to view the graphic in whole unless it’s condensed. An infographic that includes top-tier information, can pack more of a punch into a smaller area.”
The result: Introducing Brafton’s new infographic packages
The start of the year comes with an exciting upgrade: new graphic product offerings.
“These updates showcase the significant talents of our designers, who create infographics that are compulsively readable, highly stylized and results-focused,” Meredith said. “Brafton’s revised design products also pair exceptionally well with our premium editorial, video and social offerings.”
Contact us to learn more about our infographic products.
What does success look like? Check out these graphics: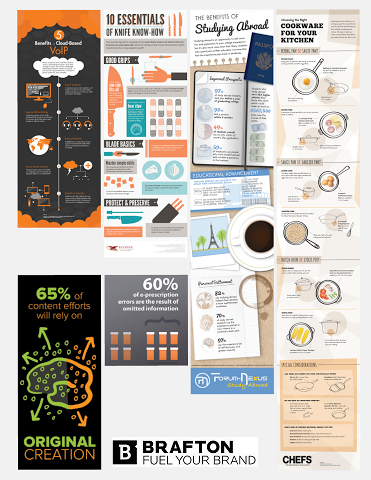
Want to learn more about Brafton’s visuals?